 Built In Oasis


Neighborhood Future Value Predictor
Functional DemoMap-first real estate growth intelligence for builders, developers, and land acquisition teams.
Location intelligence that scores ZIP codes by industry-specific expansion opportunity.
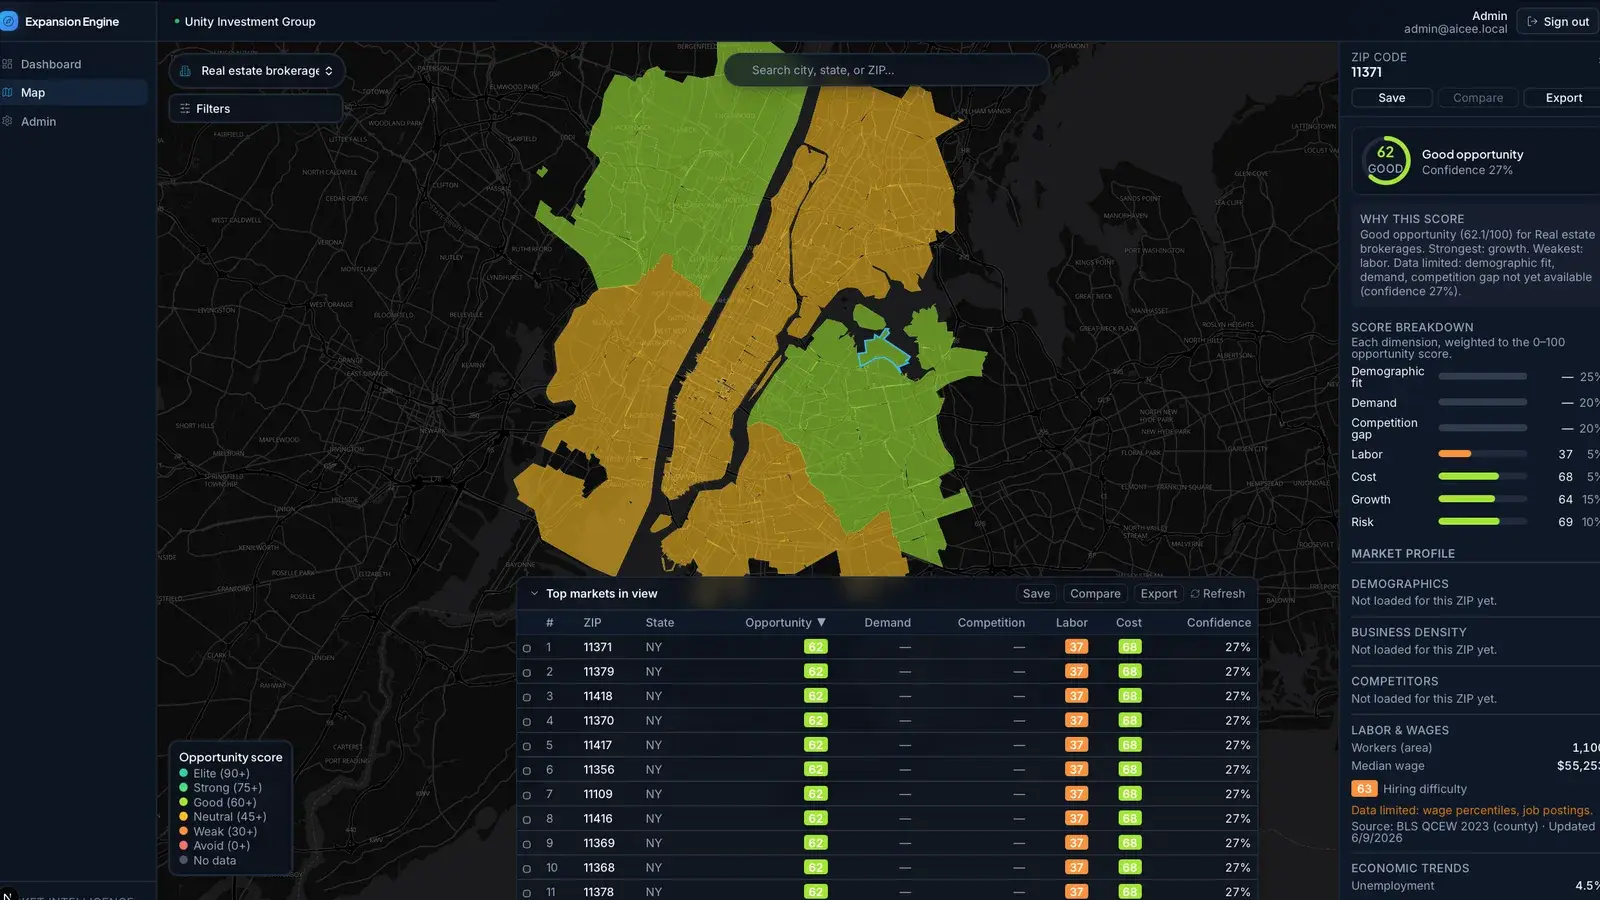
Businesses deciding where to open their next location have to stitch together fragmented research across Census data, Google Maps, job boards, labor reports, competitor research, and real estate analysis. That manual work is slow and produces no single, comparable measure of opportunity. There is no clear answer to where a business should expand next, and why.
Built for Franchises, multi-location operators, local service businesses, real estate site-selection teams, private equity operators, agencies, and SMB owners evaluating expansion markets.
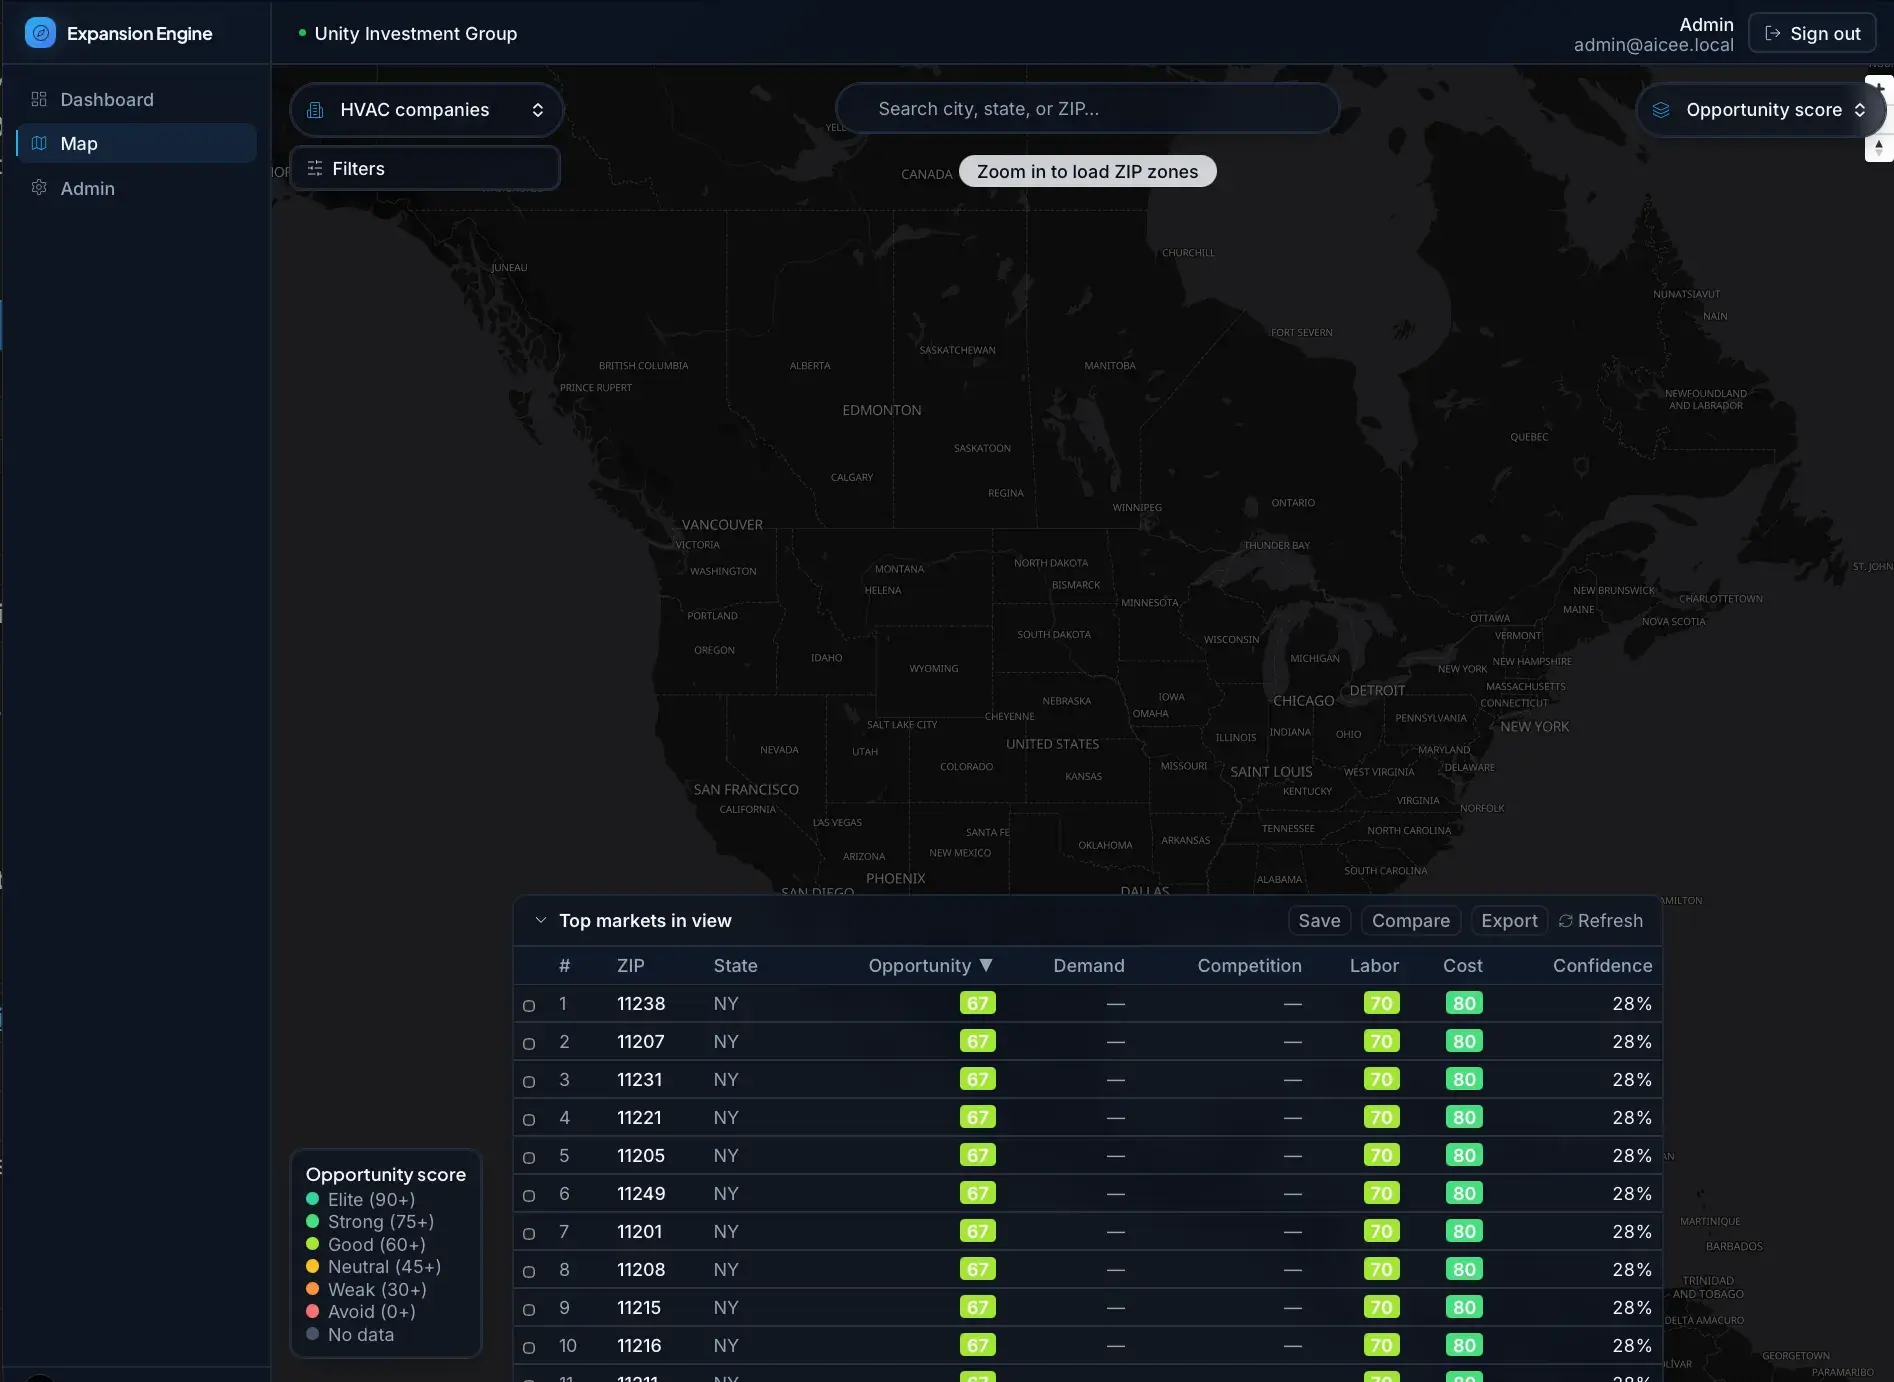
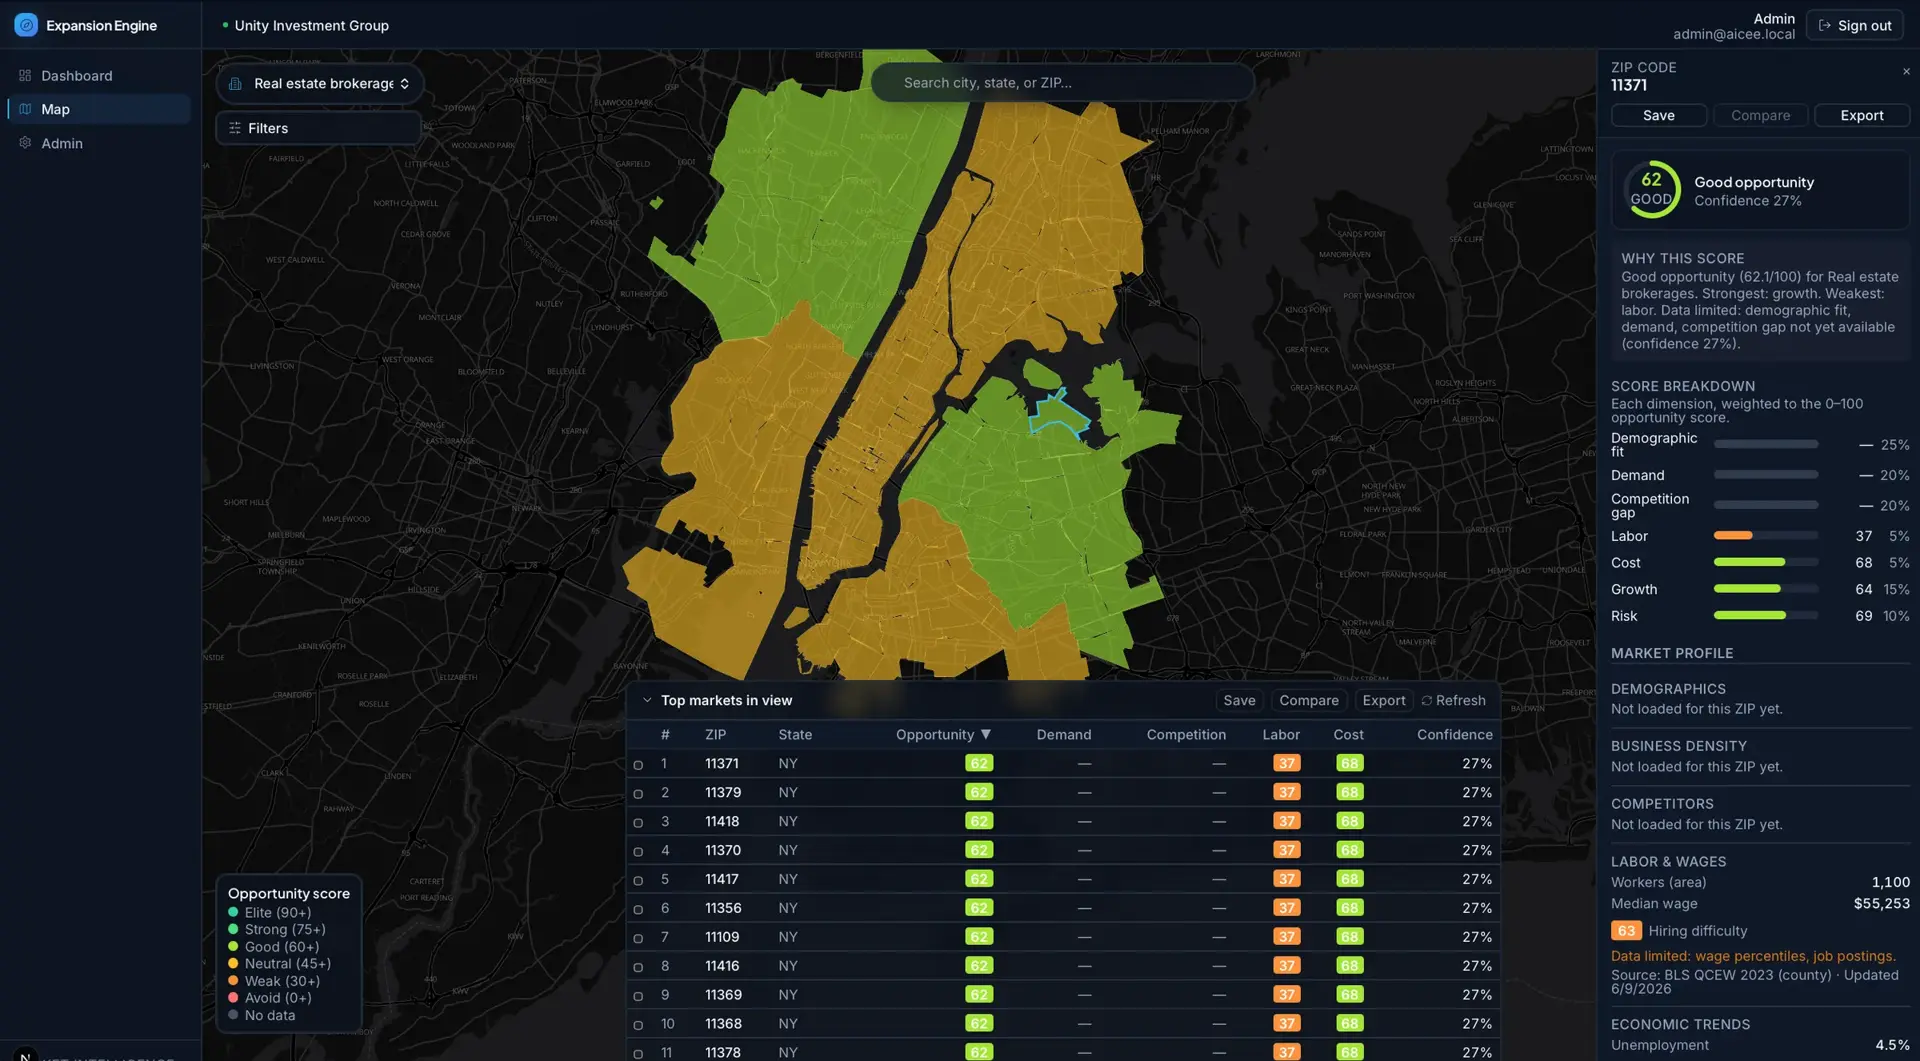
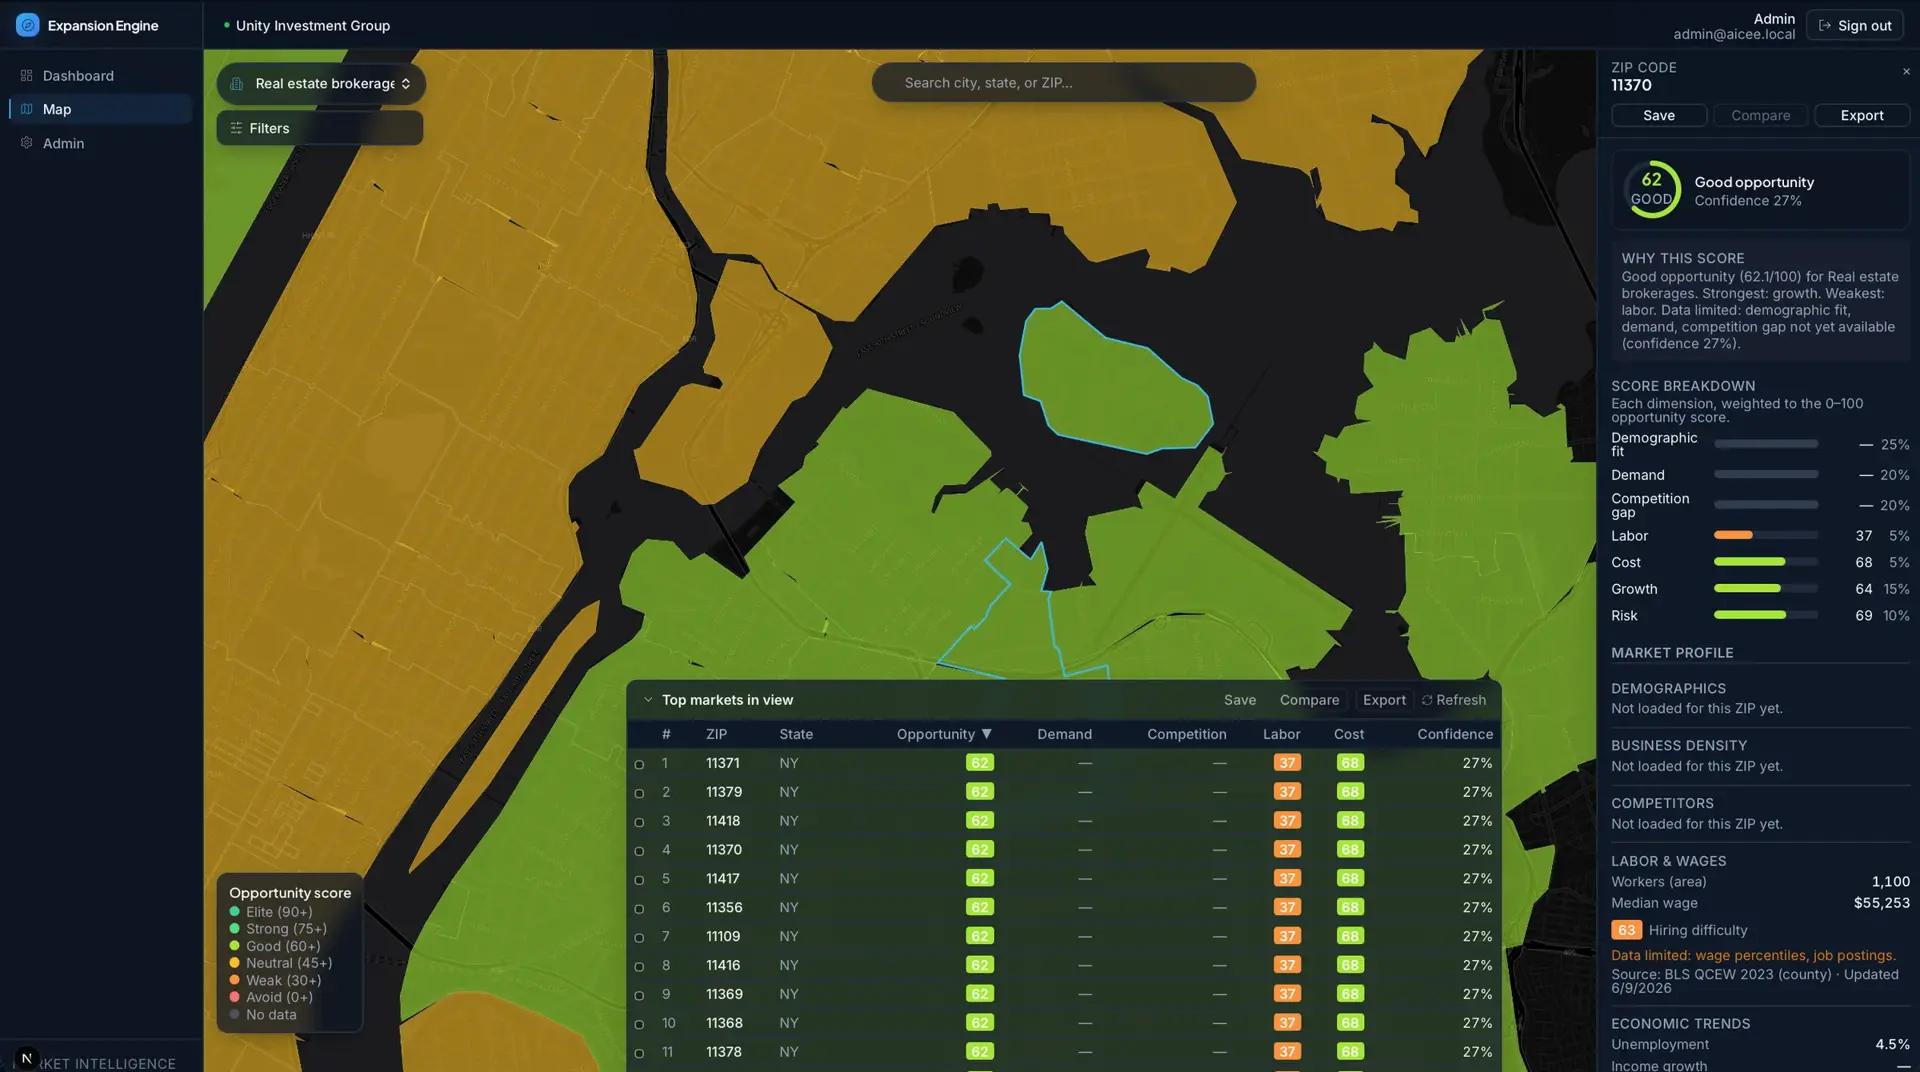
The platform turns fragmented location data into one industry-specific opportunity score per ZIP code. A user selects an industry, searches a region or scans nationwide, and sees color-coded ZIP opportunity zones on a map. Clicking a ZIP opens a breakdown across demographic fit, demand, competition gap, labor availability, cost, growth, and risk, each weighted per industry, plus an AI explanation grounded in the stored inputs. Users can filter, rank, save, compare markets, and export reports. Scores carry confidence levels so missing data lowers confidence instead of fabricating precision.
Builds a geospatial scoring engine over ZCTA polygons with per-industry weighted metrics and confidence scoring. Runs multiple external data pipelines (demographics, business patterns, competitors, labor, economic, real estate) that normalize into structured records. Adds an AI explanation layer constrained to stored score inputs so it cannot invent numbers.
This is not a generic dashboard. It is a market expansion decision engine that turns fragmented data into one clear expansion score by ZIP code.
Geospatial ZIP/ZCTA Layer
Load, store, and render ZIP polygons from Census shapefiles with viewport-optimized geometry.
Industry Configuration System
Seed 20 industries with weighted metrics, NAICS codes, competitor categories, and labor mappings.
Demographic Data Pipeline
Pull and normalize Census ACS population, income, age, homeownership, and education by ZIP.
Business Density Pipeline
Add Census Business Patterns establishment counts and NAICS-based saturation baselines.
Competition Intelligence Pipeline
Discover competitors via Google Places and Foursquare with rating, review, and weakness scoring.
Labor & Wage Intelligence
Add BLS OEWS labor availability, wage cost, and hiring difficulty per industry occupation.
Economic Trends Layer
Integrate FRED and BEA unemployment, income growth, and economic strength signals.
Real Estate & Cost Layer
Model commercial rent pressure and location affordability with industry cost assumptions.
Opportunity Scoring Engine
Combine normalized metrics into a weighted, industry-specific 0-100 expansion score.
Map-First UI
Full-screen interactive map with search, industry selector, filters, and layer toggles.
ZIP Detail Panel
Decision-quality breakdown of every score component, top competitors, and AI explanation.
Filters & Layer Controls
Refine markets by population, income, competition, labor, cost, growth, and risk.
Ranked Markets Table
Bottom drawer ranking best ZIPs with score, demand, competition, labor, and cost.
Save & Compare Markets
Build a shortlist and compare 2-5 ZIPs side-by-side with an AI comparison summary.
AI Explanation Engine
Generate grounded ZIP summaries, risk notes, and expansion memos from score inputs.
Expansion Report Generator
Produce investor-ready PDF reports with recommendations, comparisons, and data sources.
Admin Data Operations
Manage data source status, refresh jobs, API usage, and score recalculation.
Opportunity Score
Match between local population, income, and age and the industry's ideal customer.
Industry-specific demand indicators for the ZIP.
Underserved demand based on competitor density and weakness.
Supply of relevant workers and hiring difficulty.
Rent pressure and occupancy affordability.
Regional income, population, and economic growth.
Downward adjustment for market risk factors.
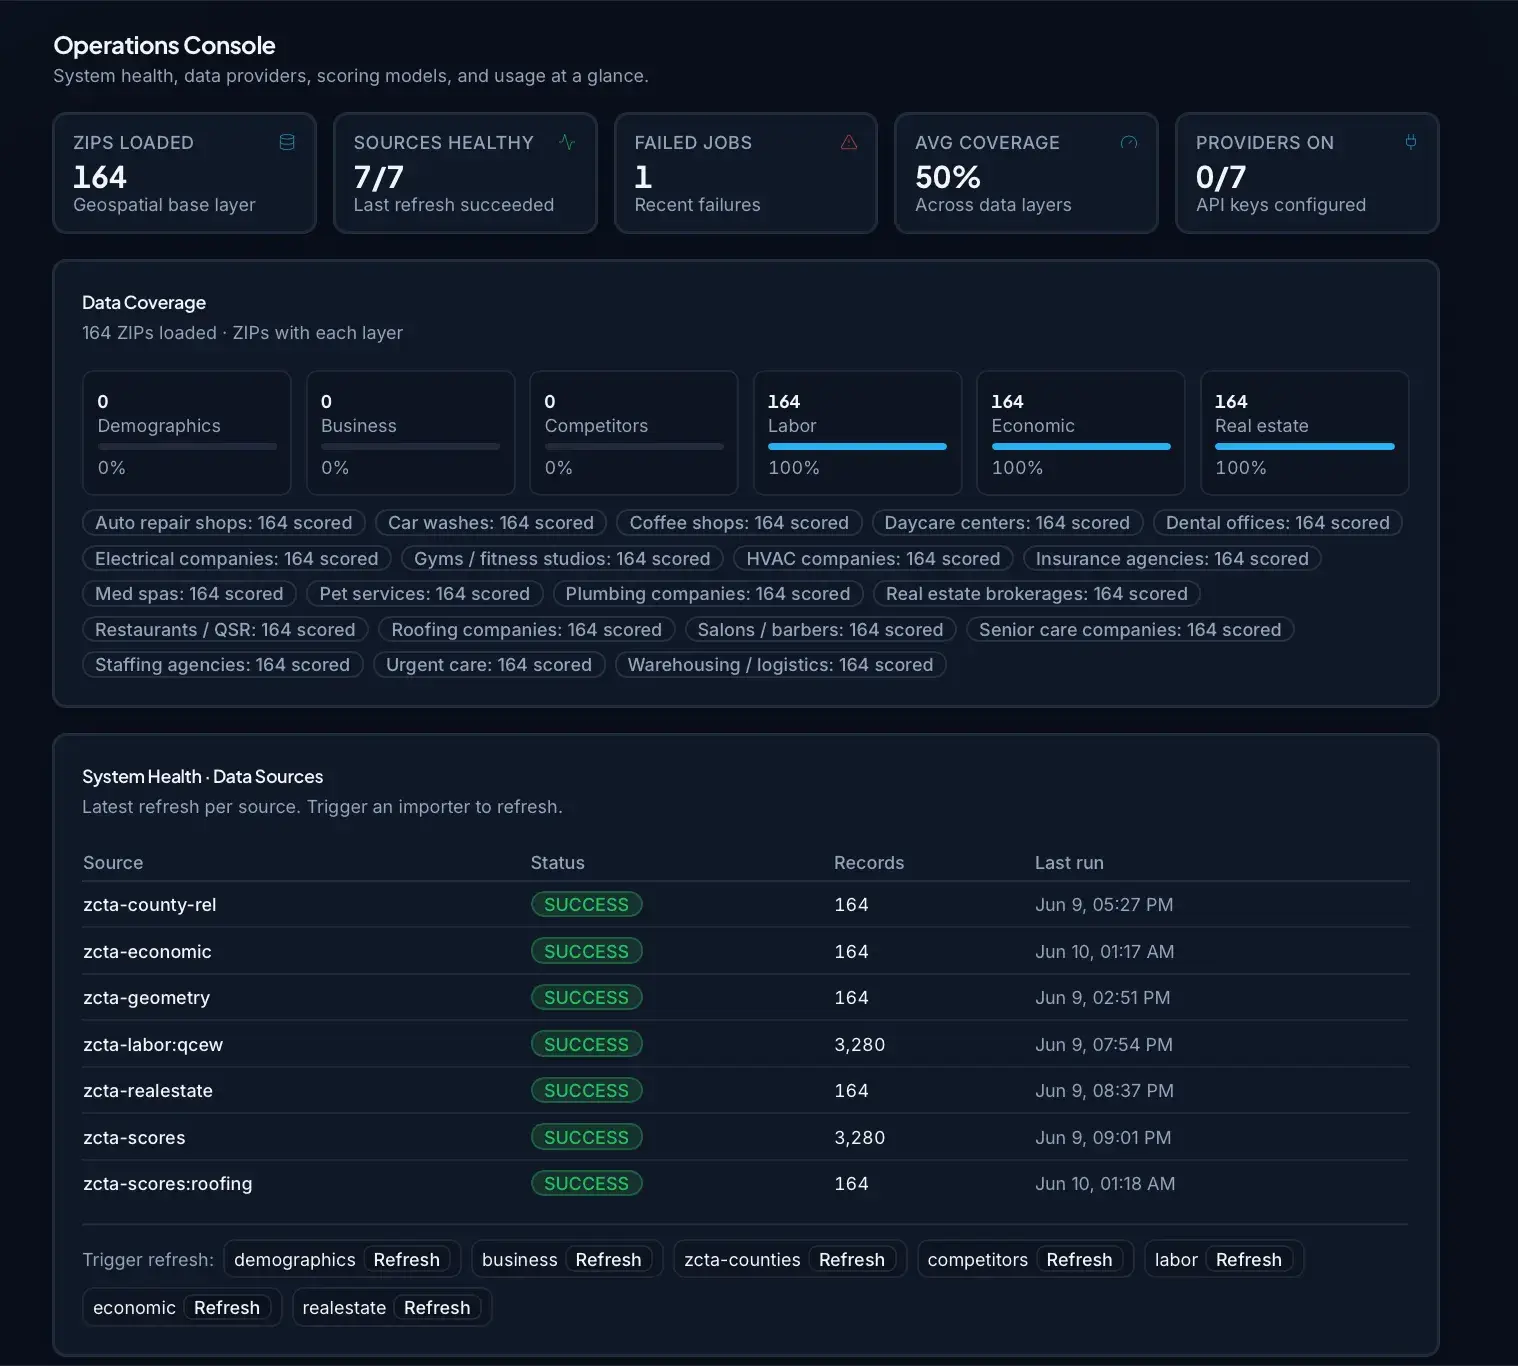
A Next.js/React frontend renders a MapLibre map of ZIP zones; the backend uses Prisma over PostgreSQL with import scripts that ingest and normalize each data source, a deterministic scoring engine, and an Anthropic-backed explanation service. Auth.js handles authentication and Upstash provides optional distributed rate limiting.
Map-first real estate growth intelligence for builders, developers, and land acquisition teams.
Material price-shock monitoring that ties supplier price movement to margin exposure and pricing recommendations.
Discover evidence-backed micro-SaaS opportunities from live market signals across industries and regions.
Start a project and reference this one — the conversation begins with what you have already seen.
Start a project