Live ProductionBusiness PlatformAdvanced2024–present

Aerial Insights

Computer vision on aerial and street-view imagery that turns roofs into storm-scored contractor leads.
Aerial Insights — cover

Overview

A lead-generation platform for exterior contractors. Draw an area on the map and it pulls street-view imagery, runs computer-vision detection to identify each property’s roof and exterior materials, and scores every roof against the hail and wind history that has already exceeded what those materials can take. The result is a ranked, filterable lead list that flows straight into skip tracing and direct-mail outreach — the same imagery serving field crews, office estimators, and marketing.

What this demonstrates

Computer-vision inference over street-view imagery to detect and classify roofing materials, geospatial polygon extraction of every property in a drawn area, storm-exceedance scoring against NOAA and hail data, list management with skip-trace enrichment, and direct-mail campaign generation and tracking — background-processed and served to both an internal dashboard and a client-facing portal.
Screens · 12

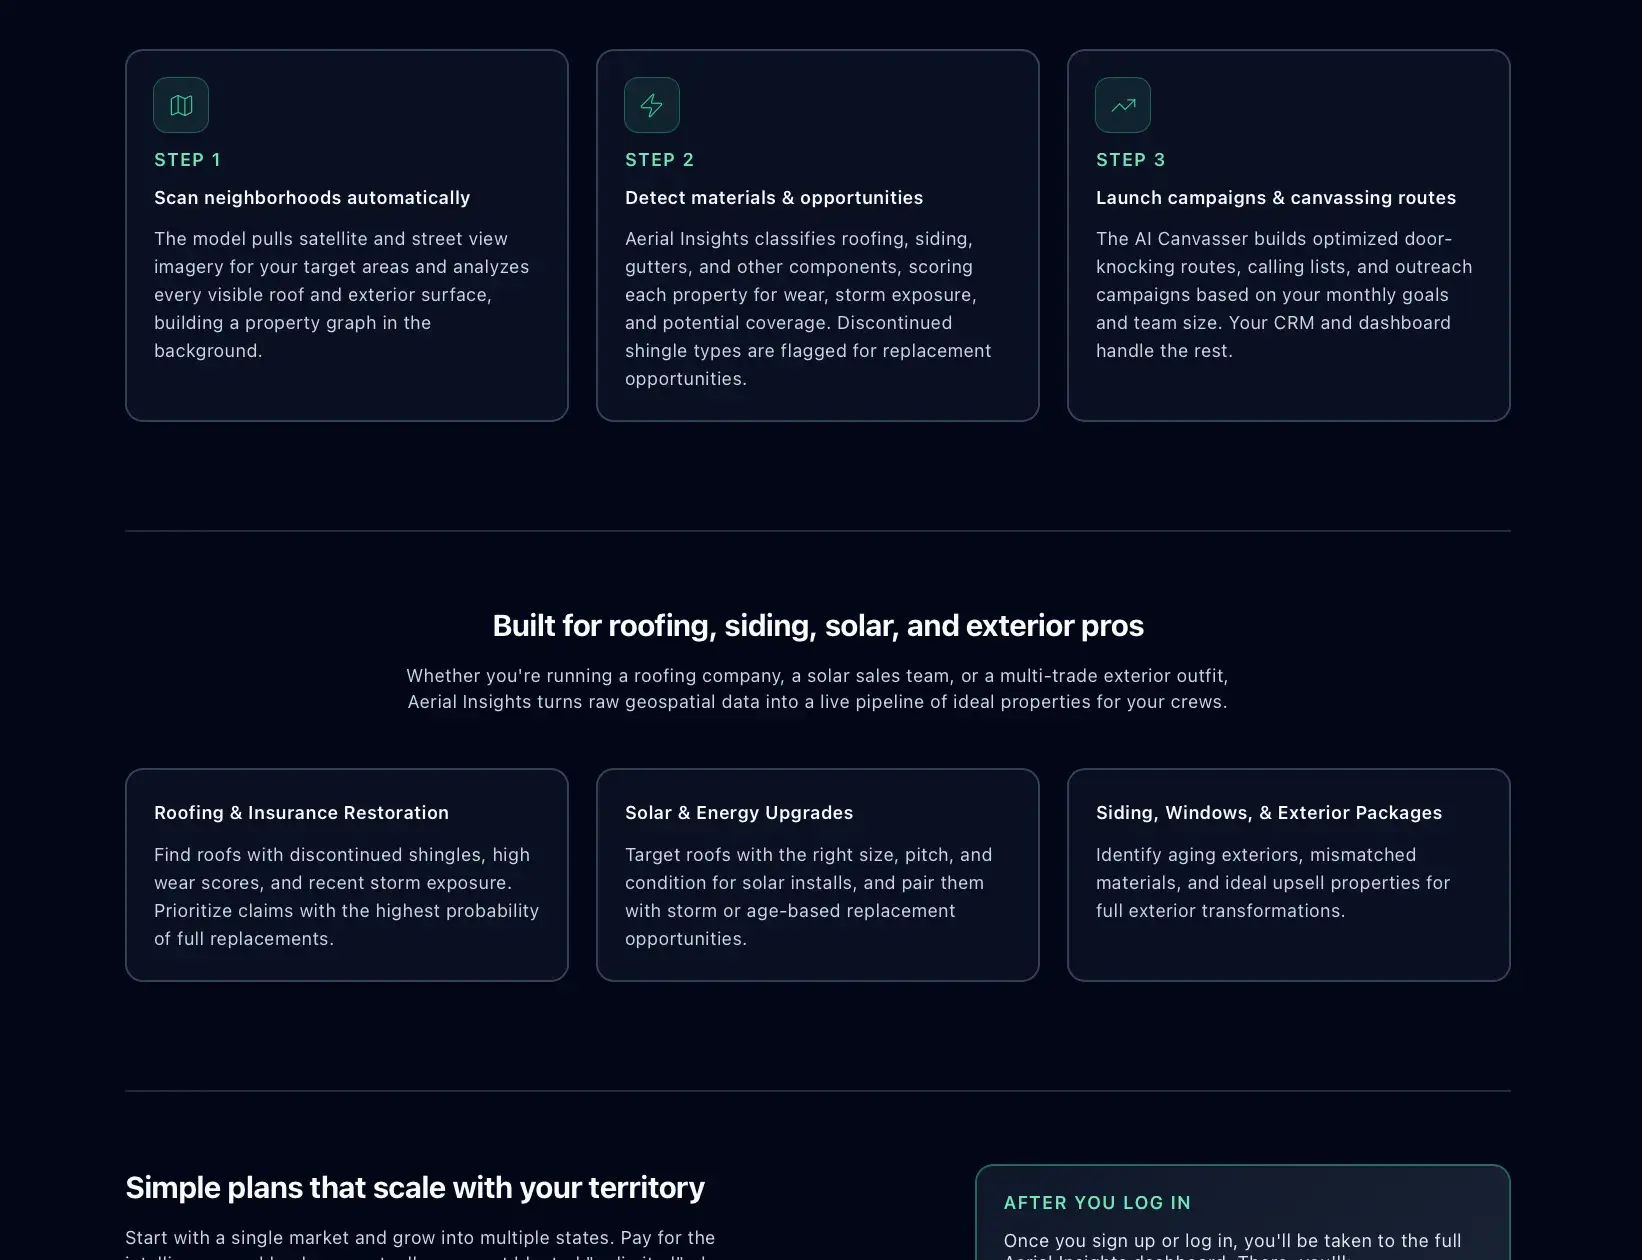
Aerial Insights 'how it works' marketing section with three numbered steps (scan, detect, launch campaigns) and three audience cards for roofing, solar, and siding pros.
How it works and target trades
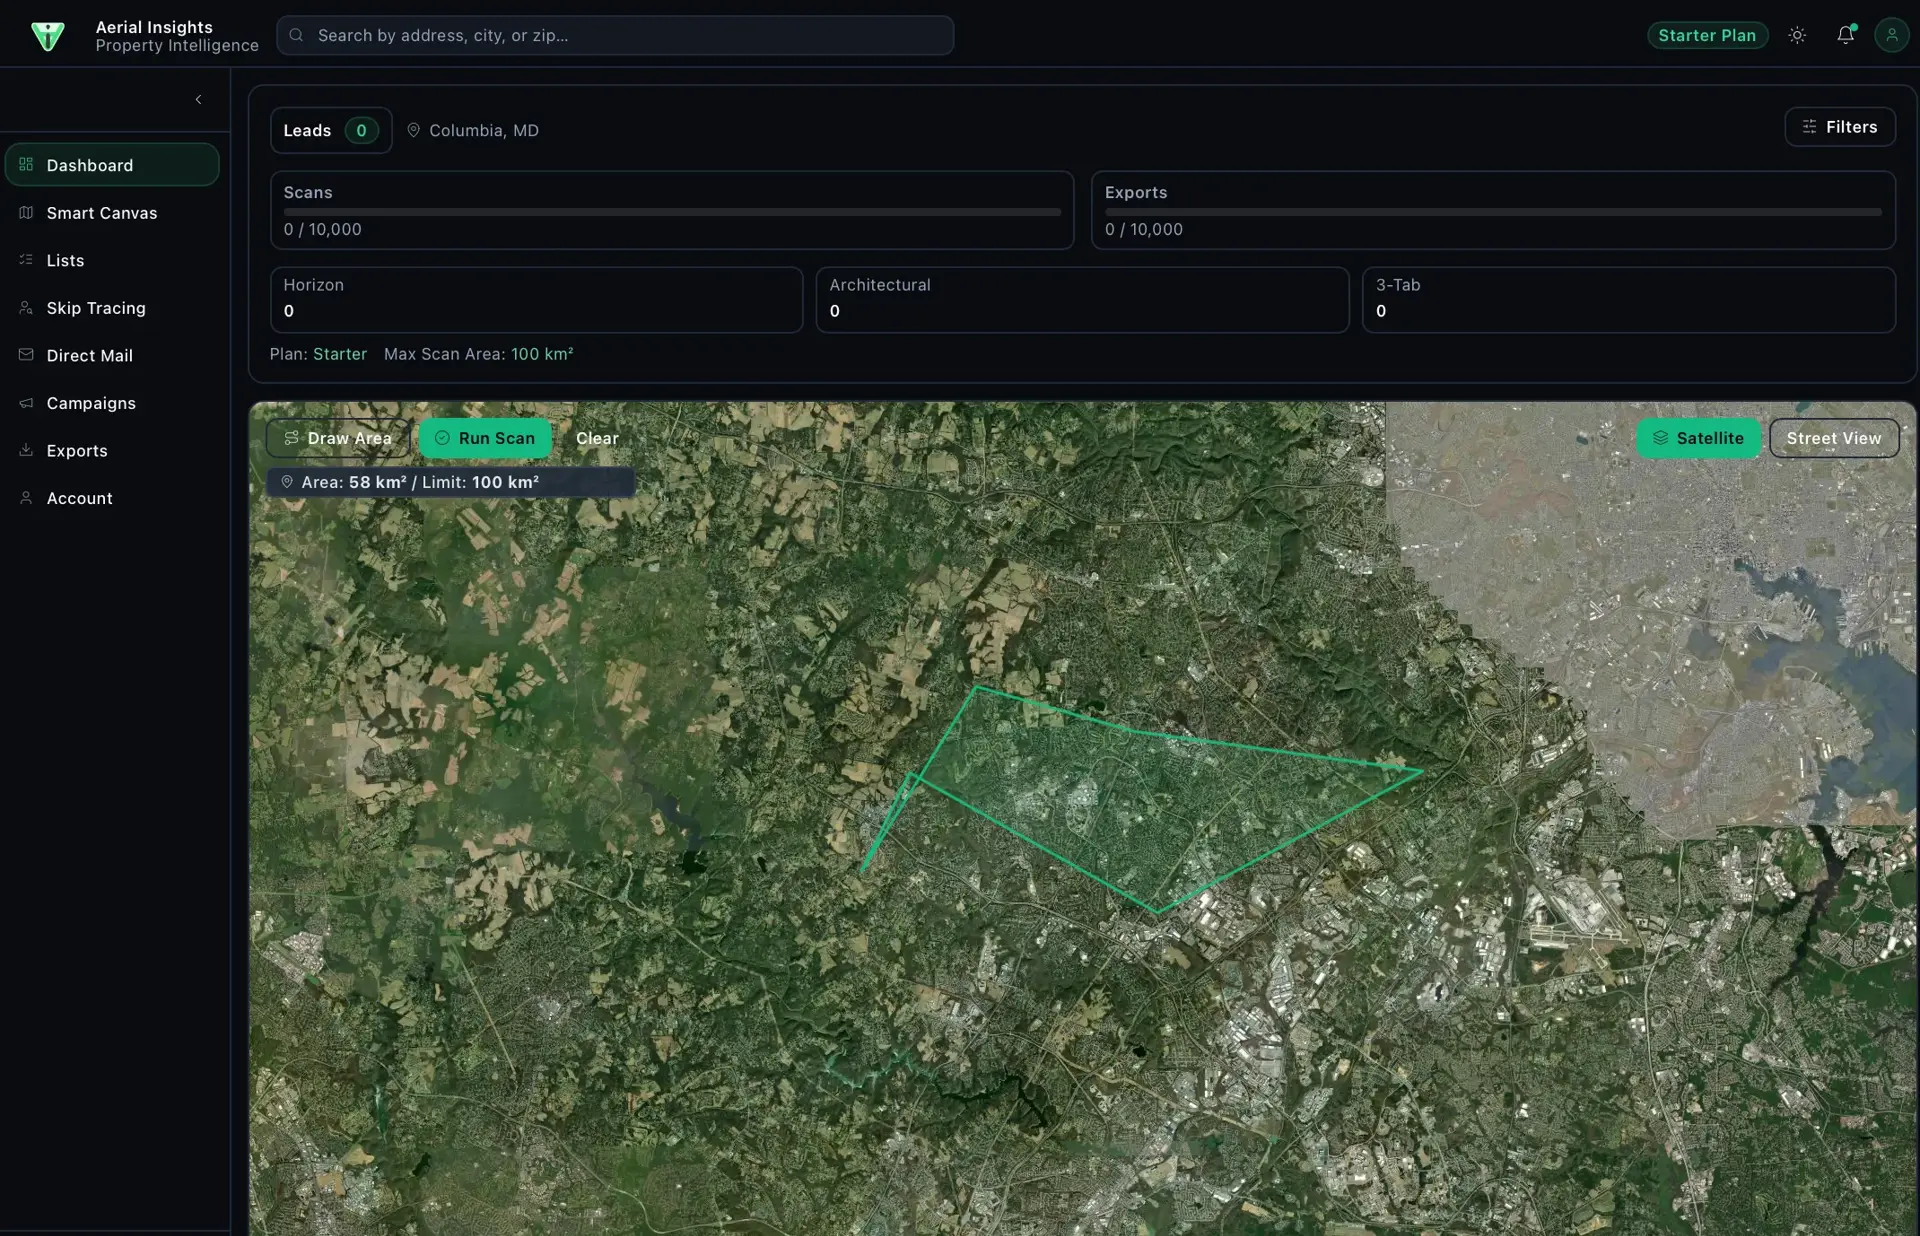
Aerial Insights dashboard with a dark left nav and a satellite map of Columbia, MD; a drawn 58 km² scan polygon, usage meters for scans and exports (0/10,000), and roof-type counters.
Dashboard — scan-area drawing on satellite map
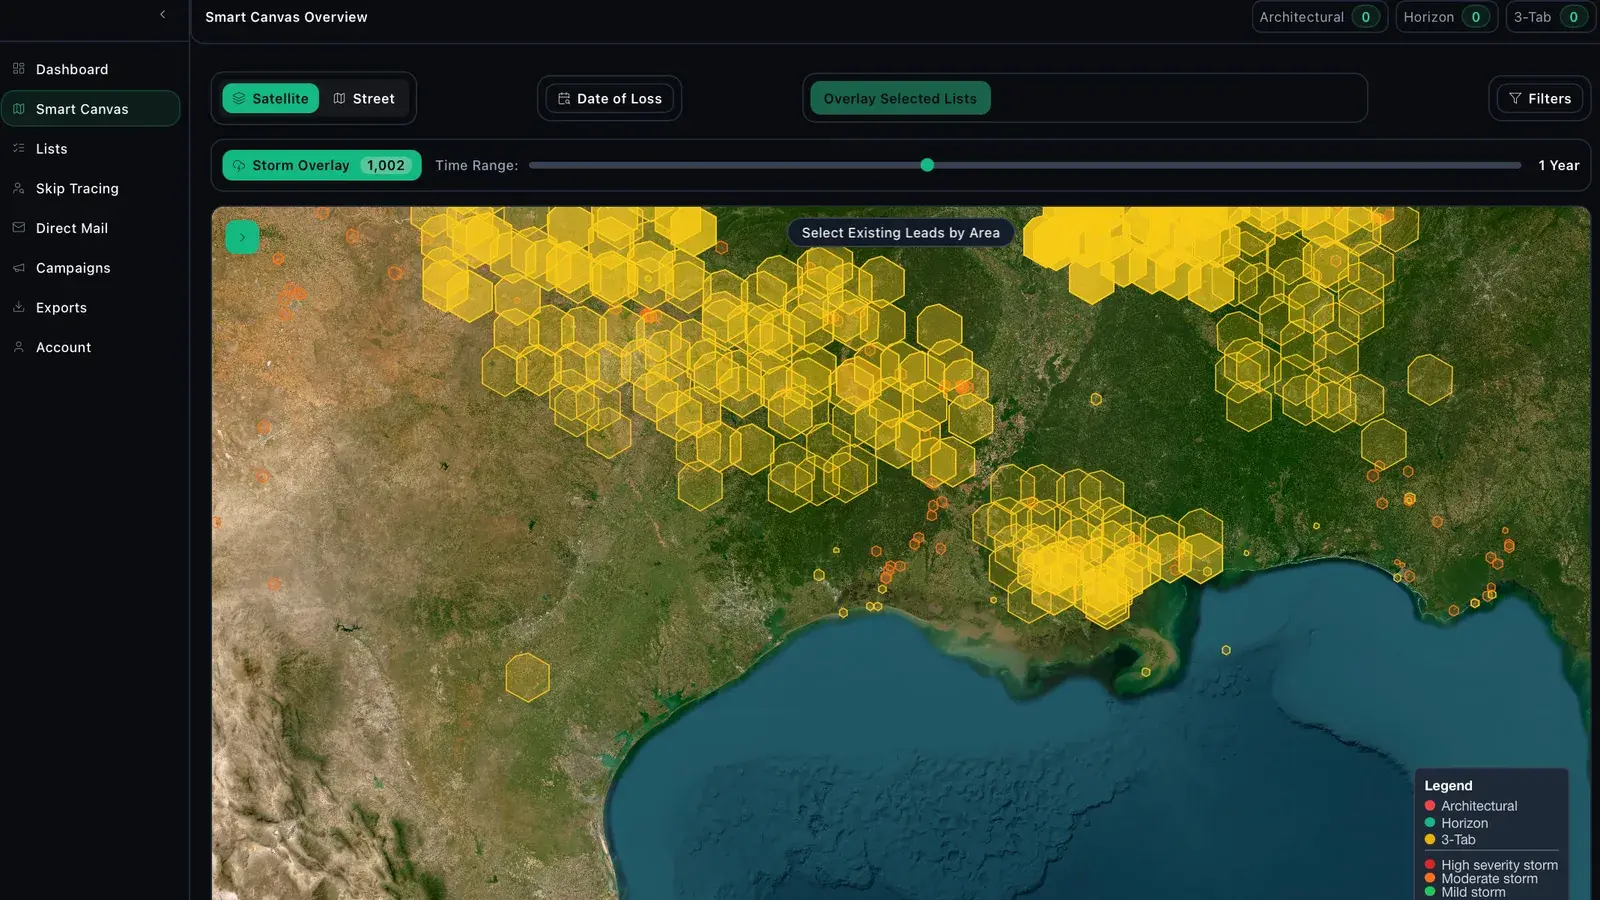
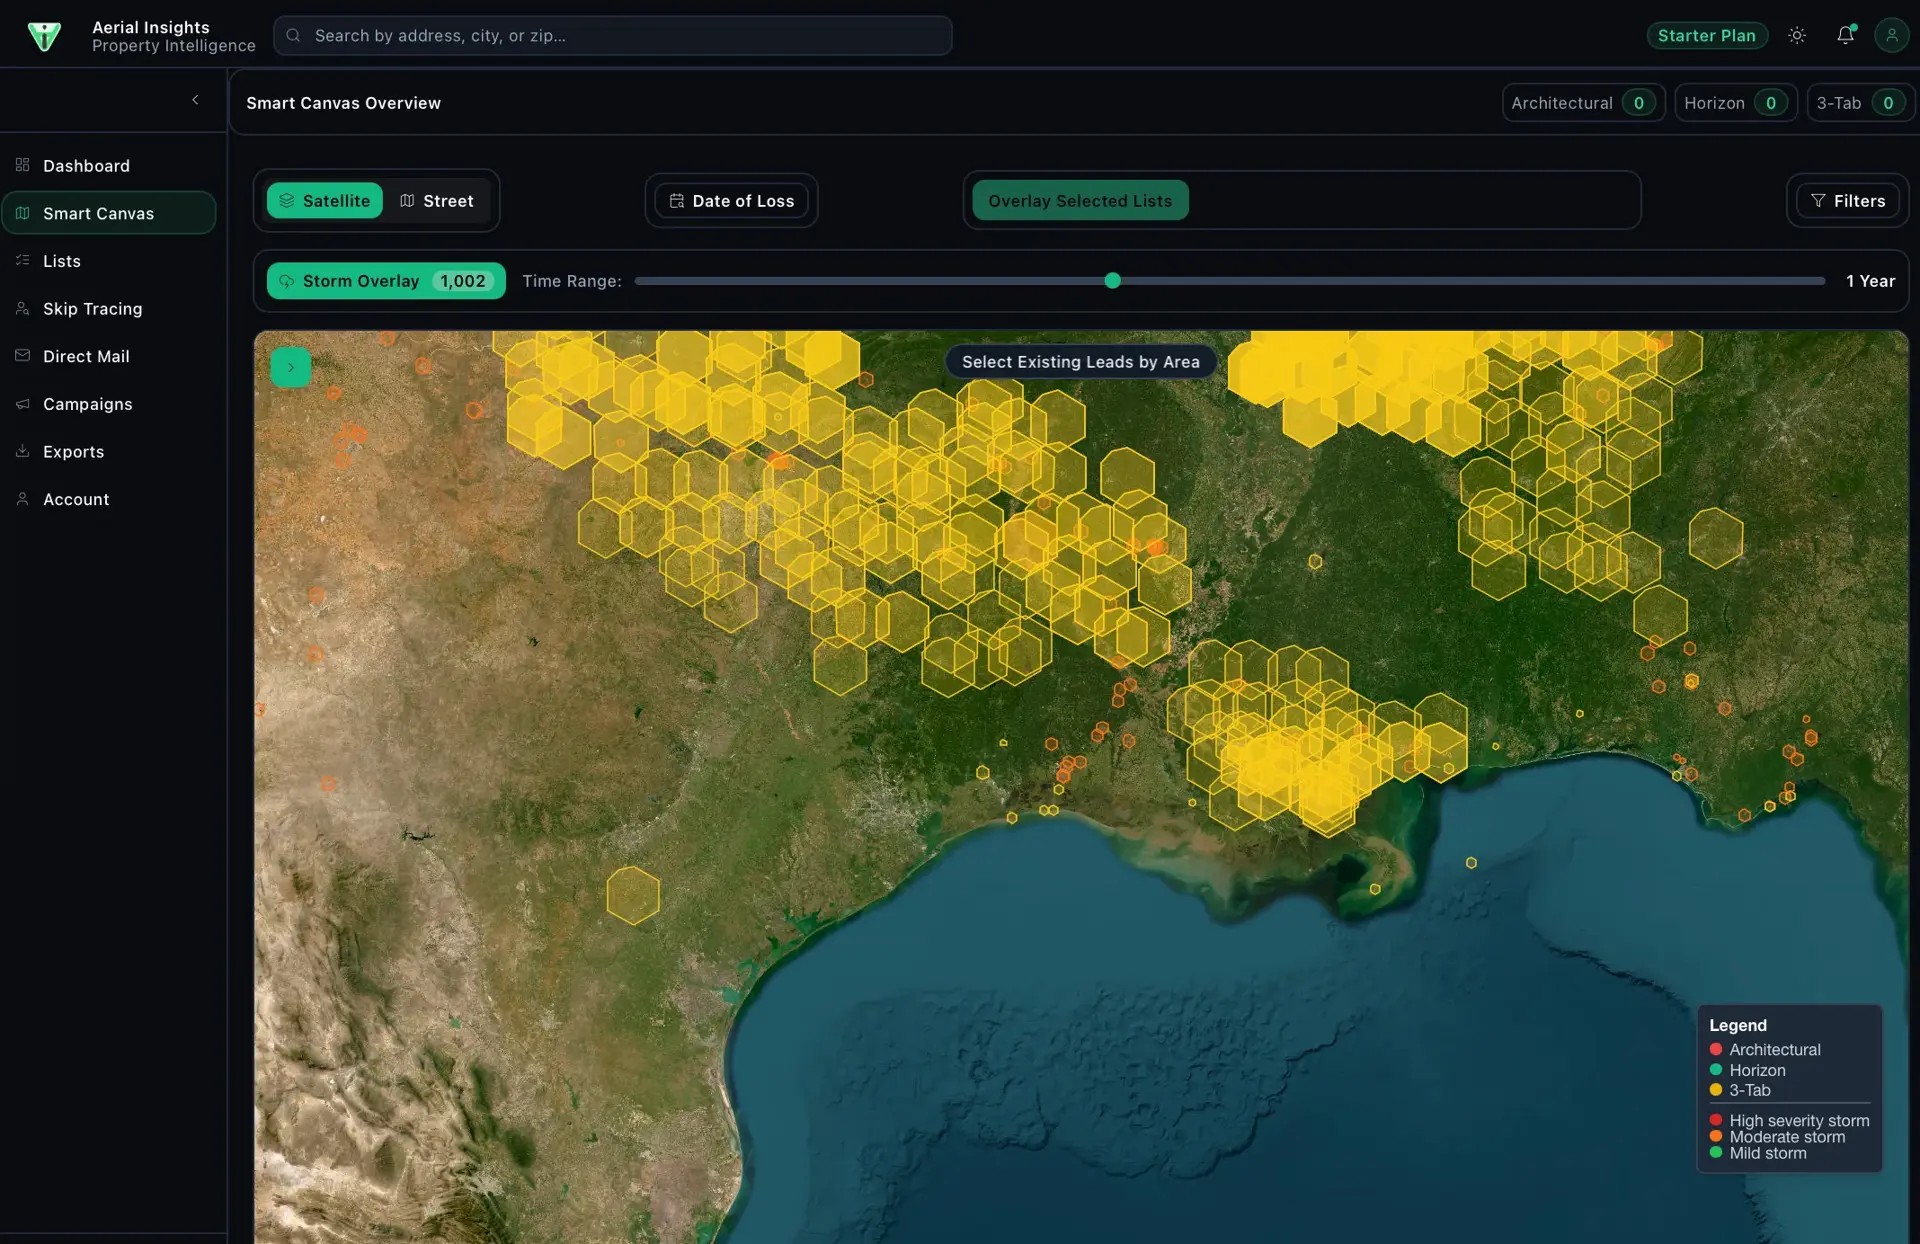
Aerial Insights Smart Canvas showing a satellite map of the Texas Gulf Coast blanketed in yellow storm-overlay hexbins (1,002), with a severity legend and roof-type filters.
Smart Canvas — storm overlay hexbins over Texas
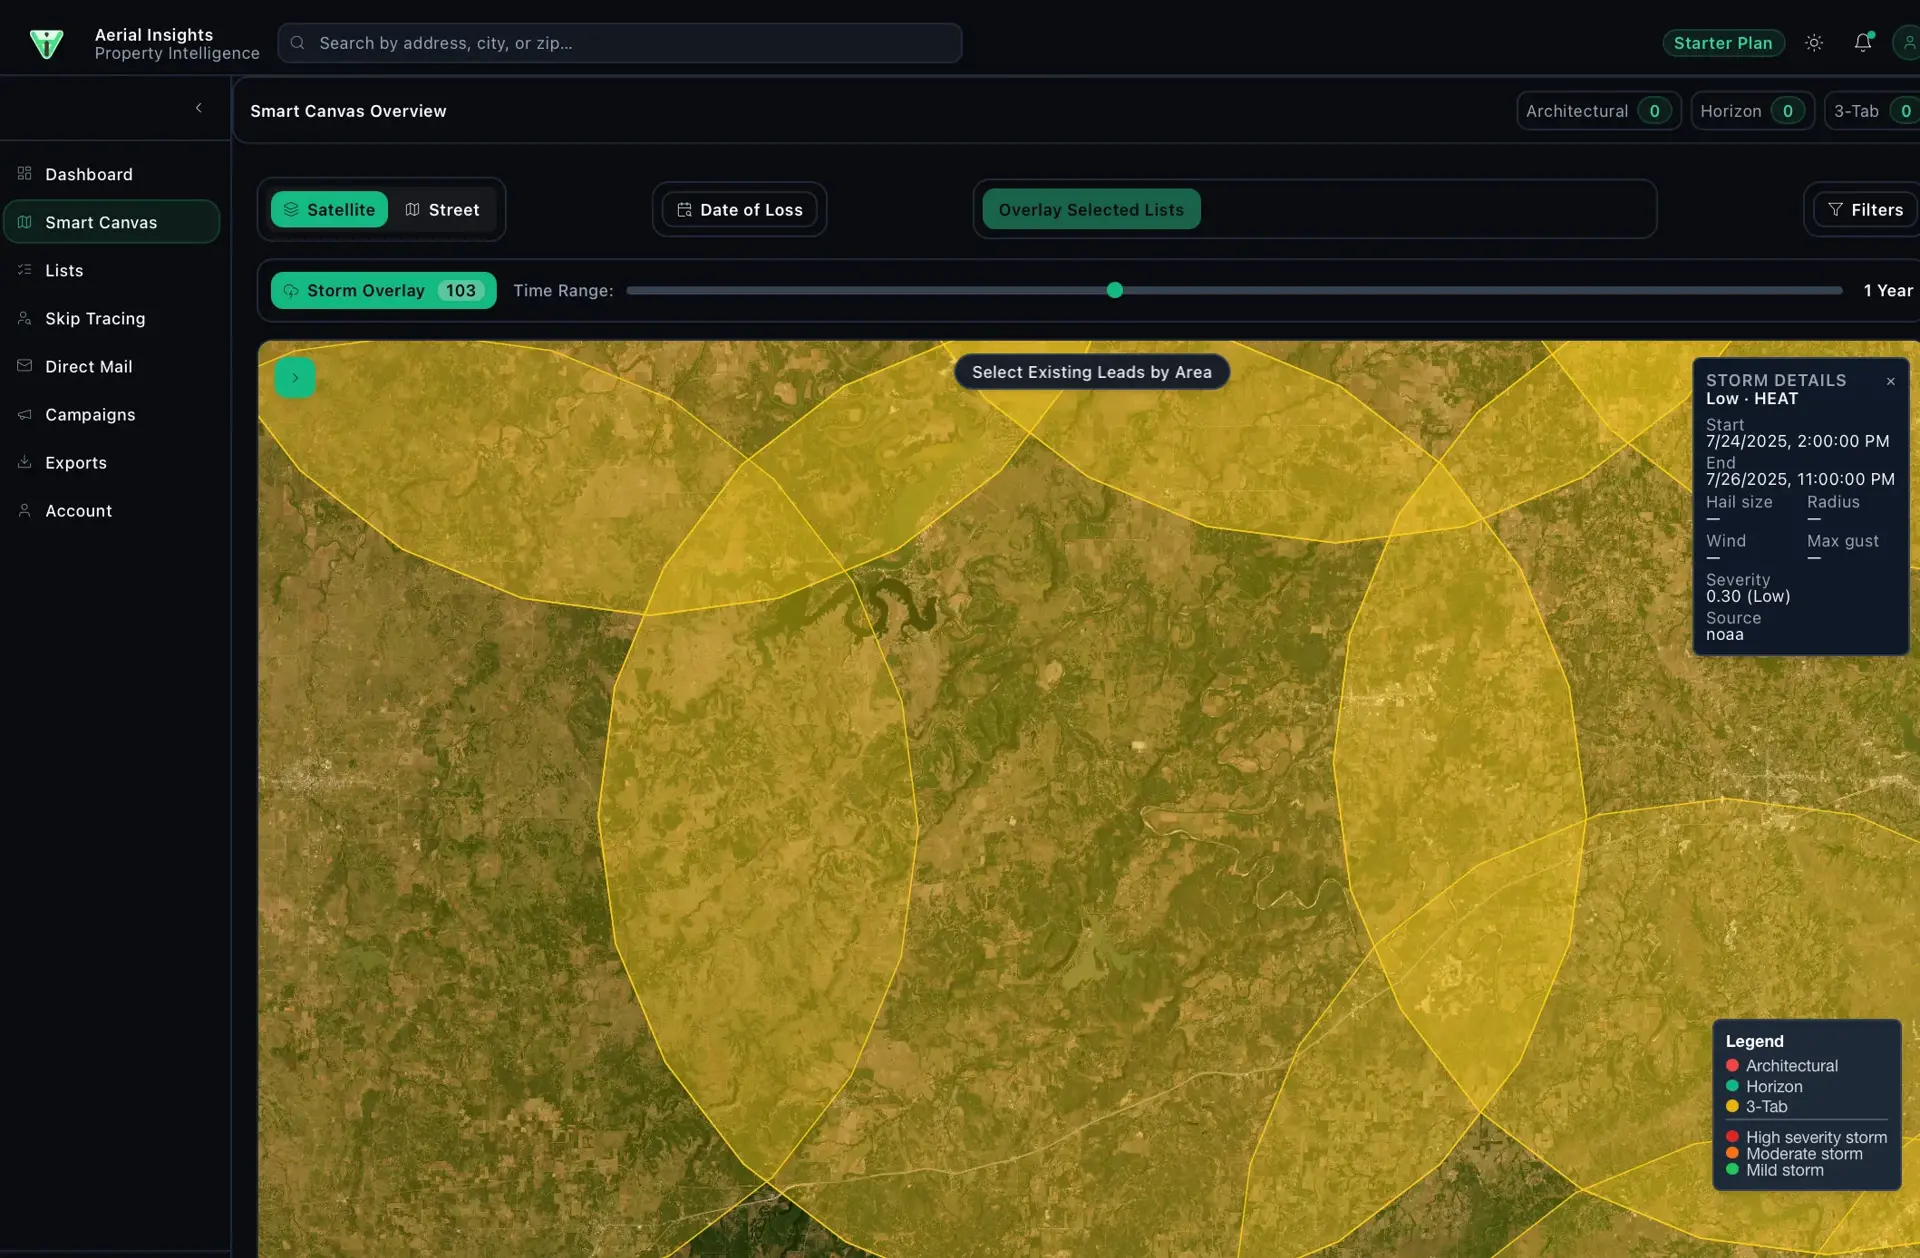
Aerial Insights Smart Canvas zoomed in with yellow storm circles and a Storm Details panel showing a low-severity HEAT event, start/end dates, 0.30 severity, and NOAA source.
Smart Canvas — storm details popup
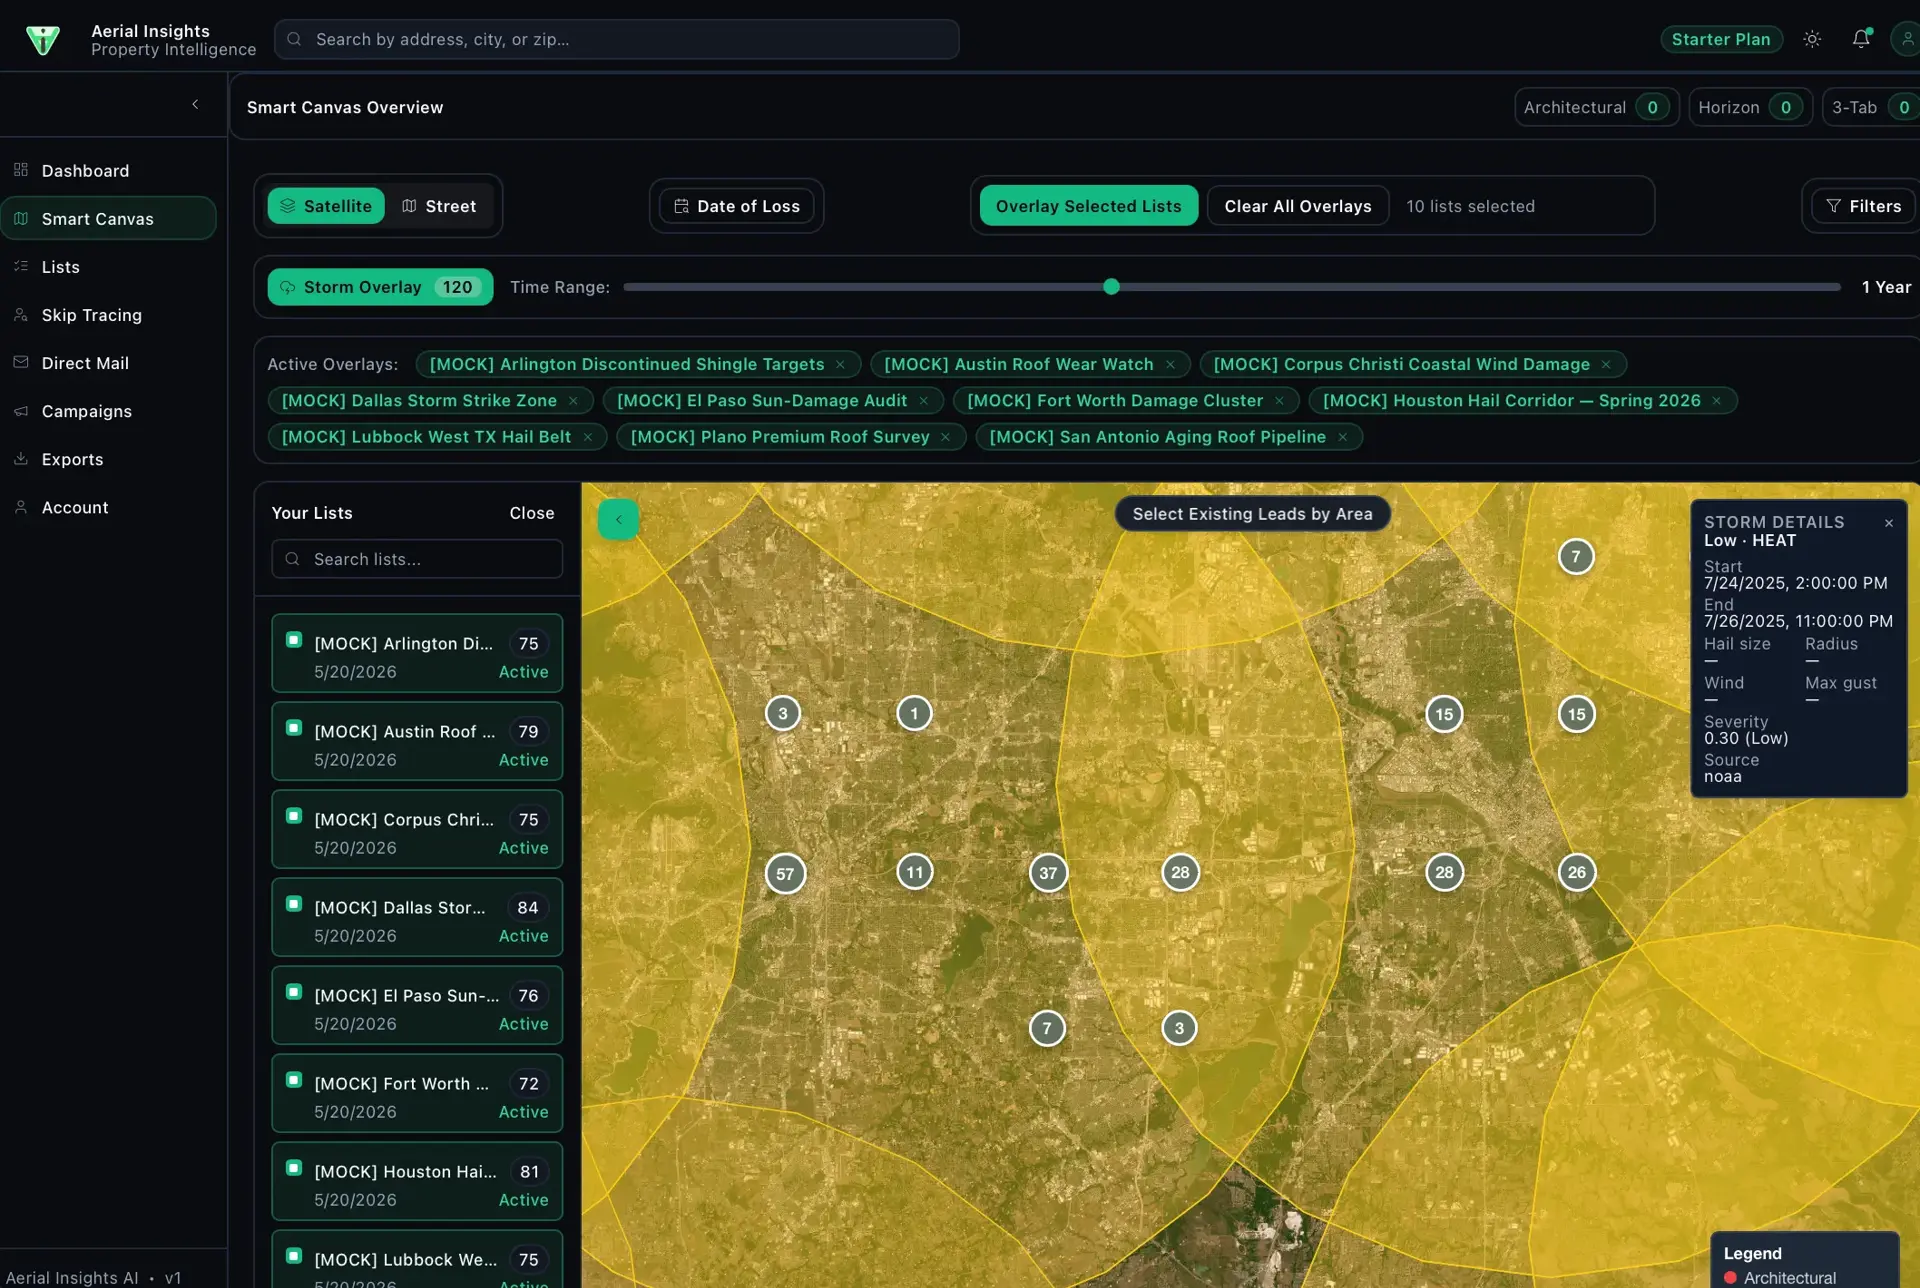
Aerial Insights Smart Canvas with 10 mock lead lists selected as active overlays, a 'Your Lists' sidebar, numbered lead clusters on a Dallas-area map, and a storm-details panel.
Smart Canvas — overlaid lists with lead clusters
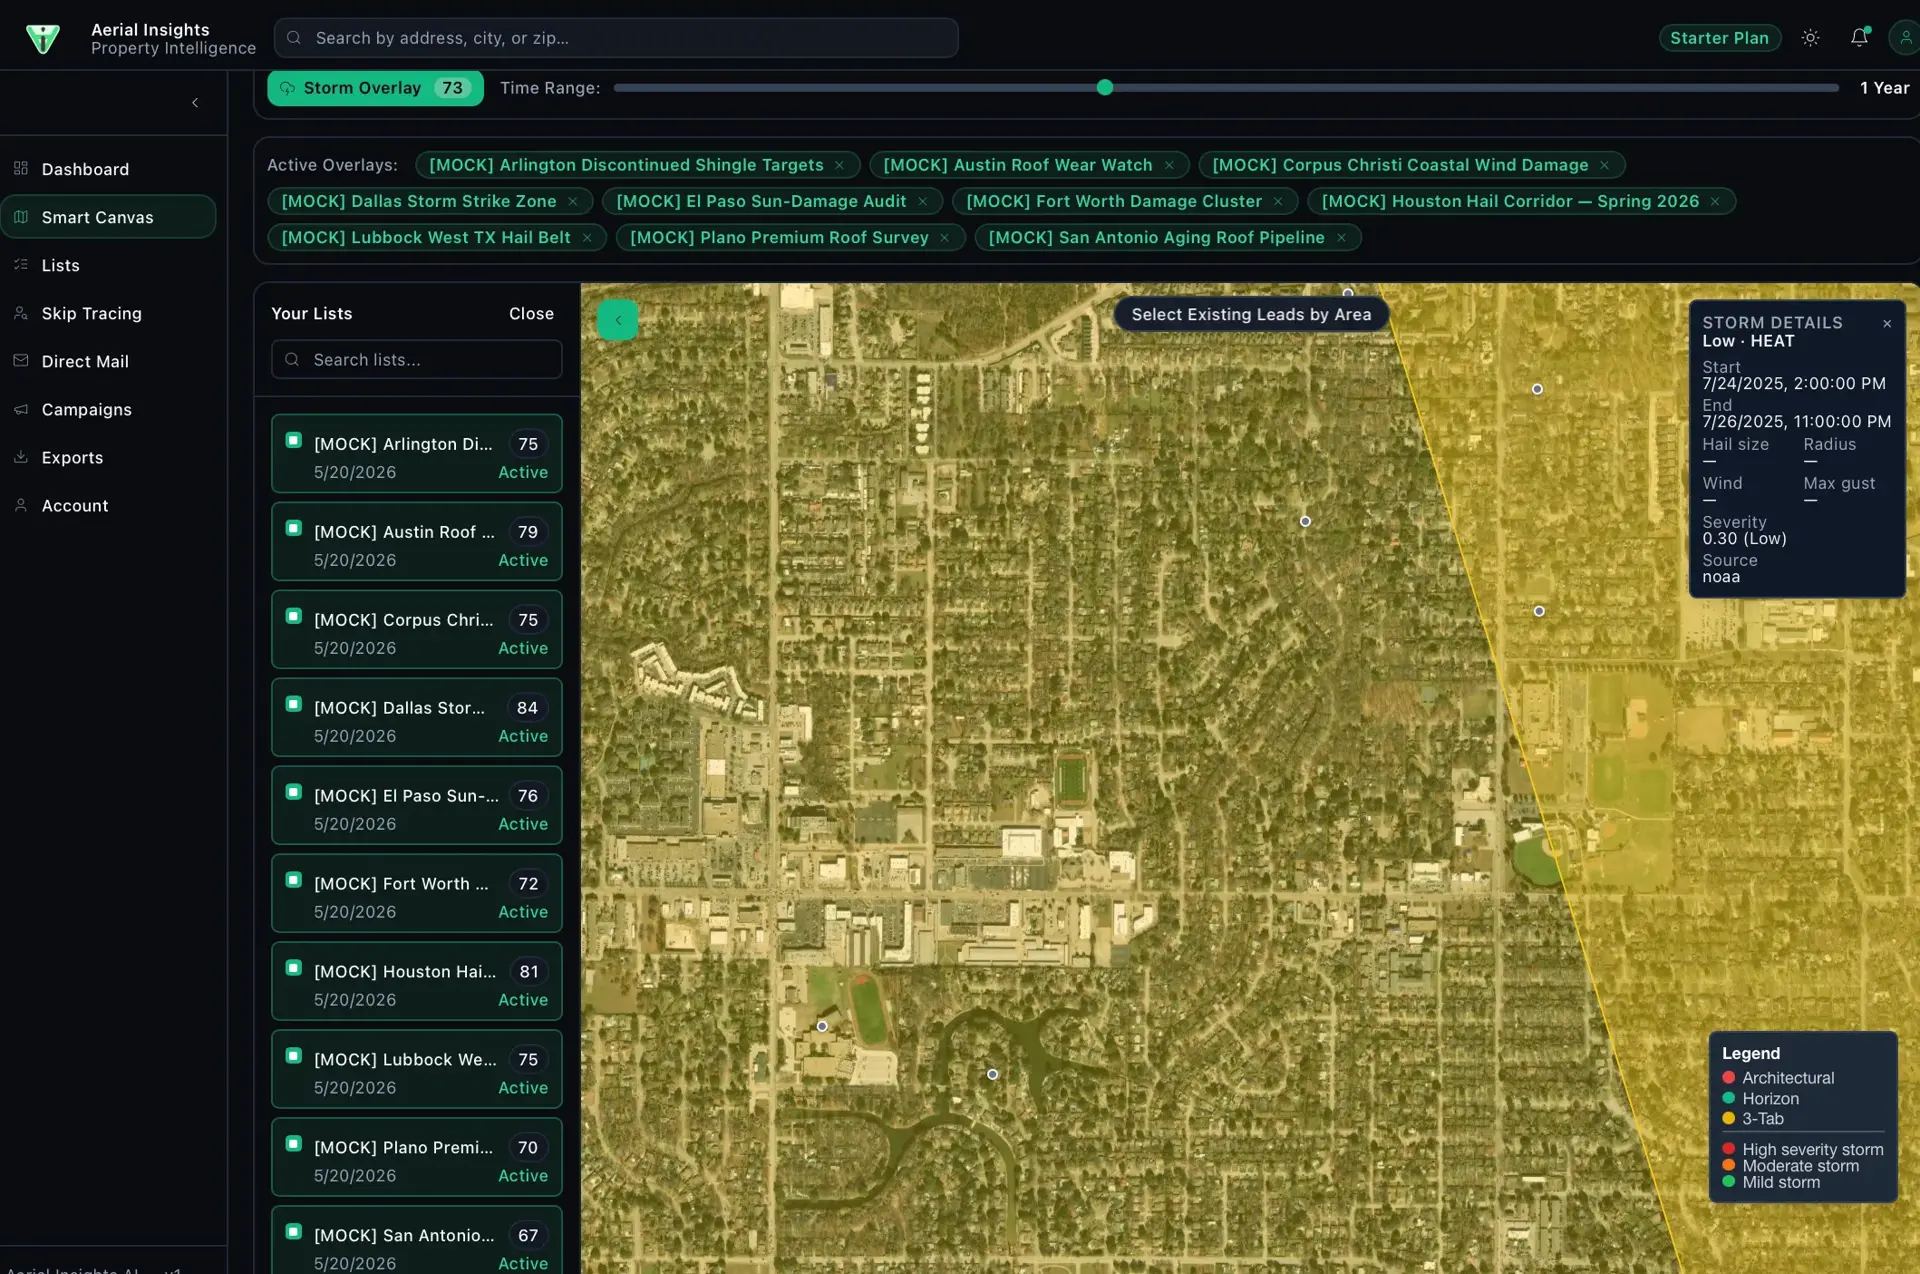
Aerial Insights Smart Canvas zoomed to a residential neighborhood in satellite view, with individual property lead pins, the lists sidebar, and an open storm-details panel.
Smart Canvas — neighborhood-level lead pins
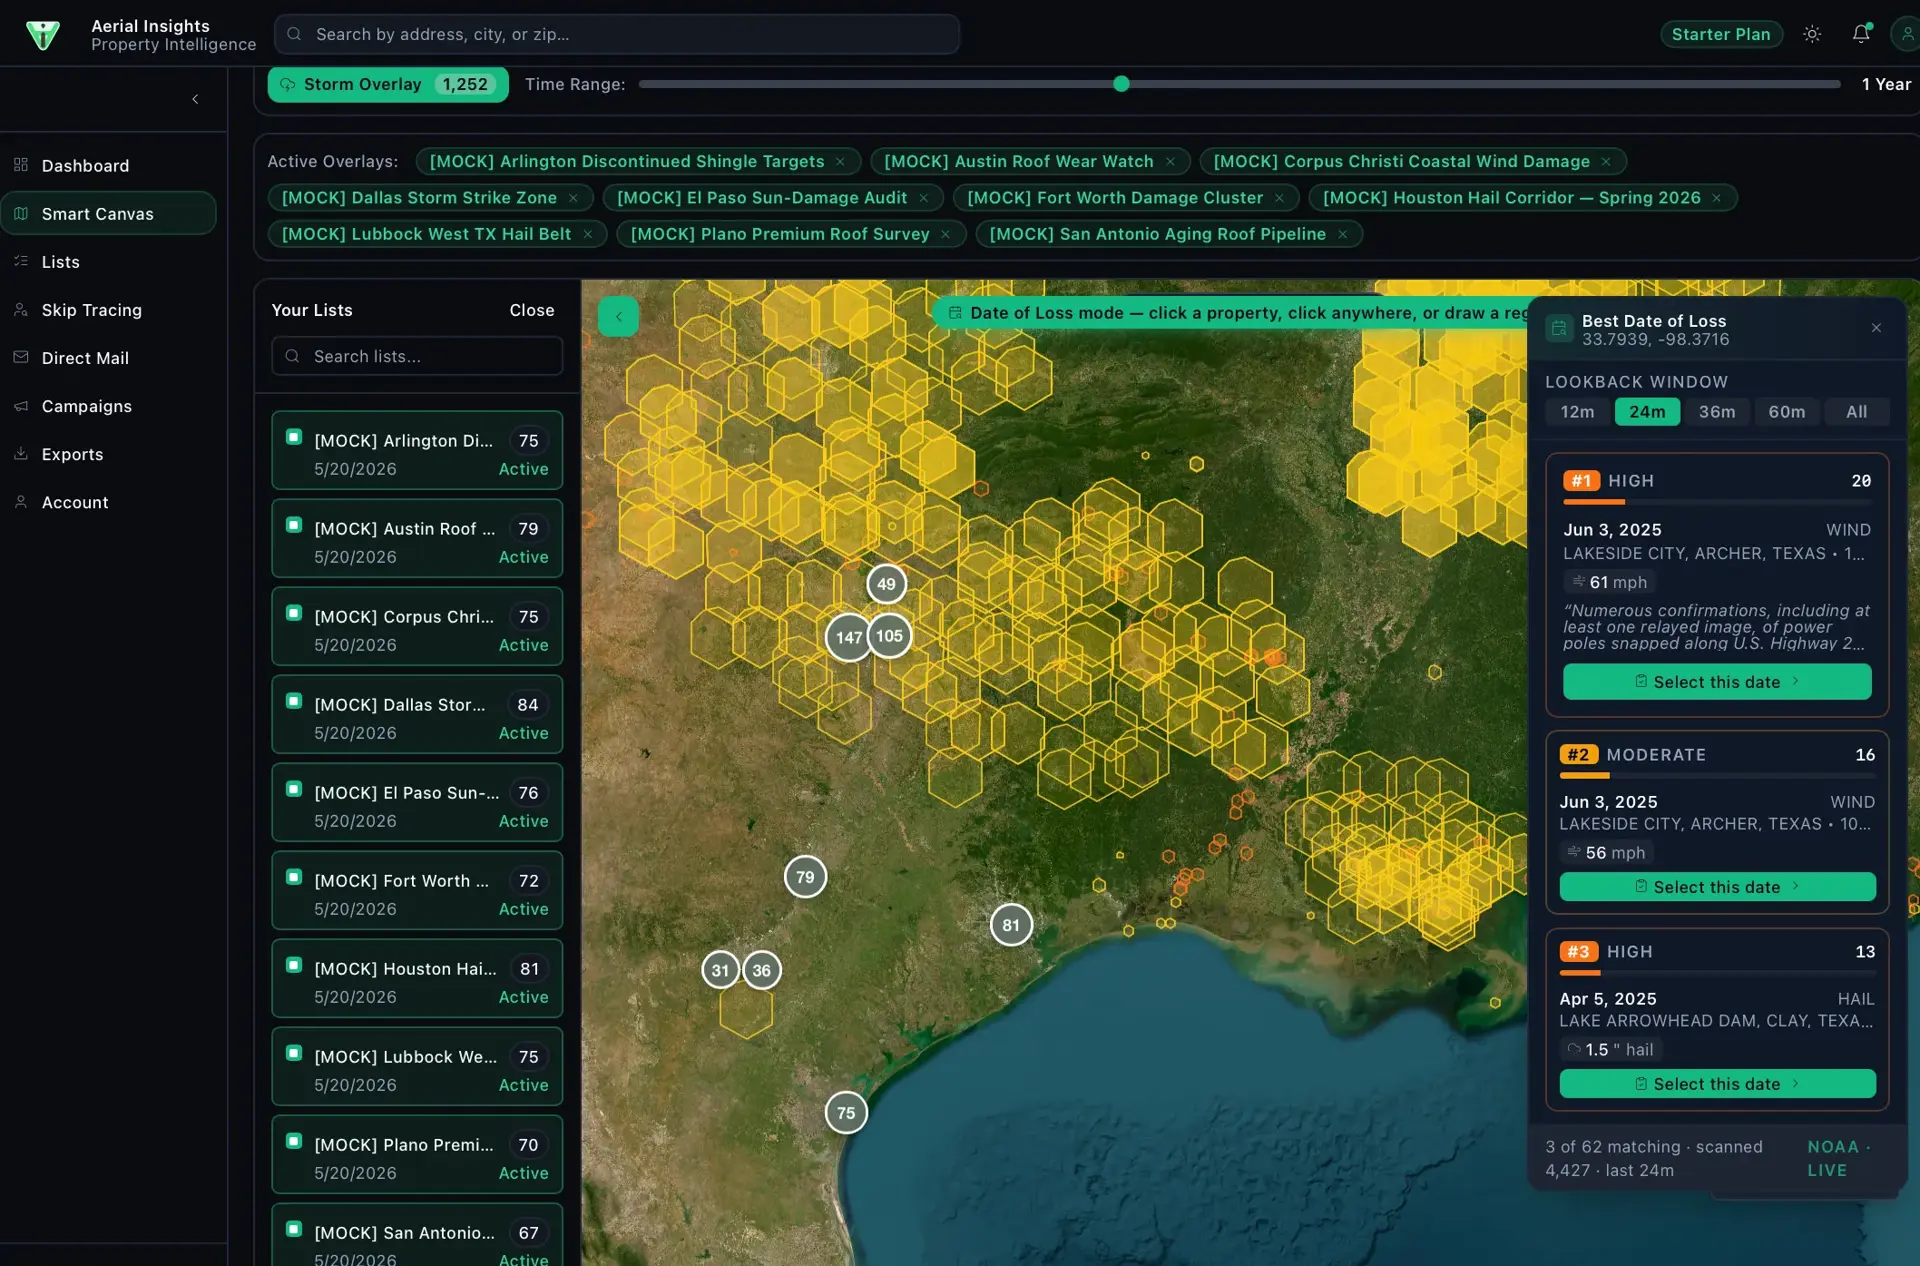
Aerial Insights Smart Canvas in Date-of-Loss mode: a storm-hexbin map with a ranked 'Best Date of Loss' panel listing high/moderate wind and hail events with dates, wind speeds, and select buttons.
Date-of-Loss mode with ranked storm events
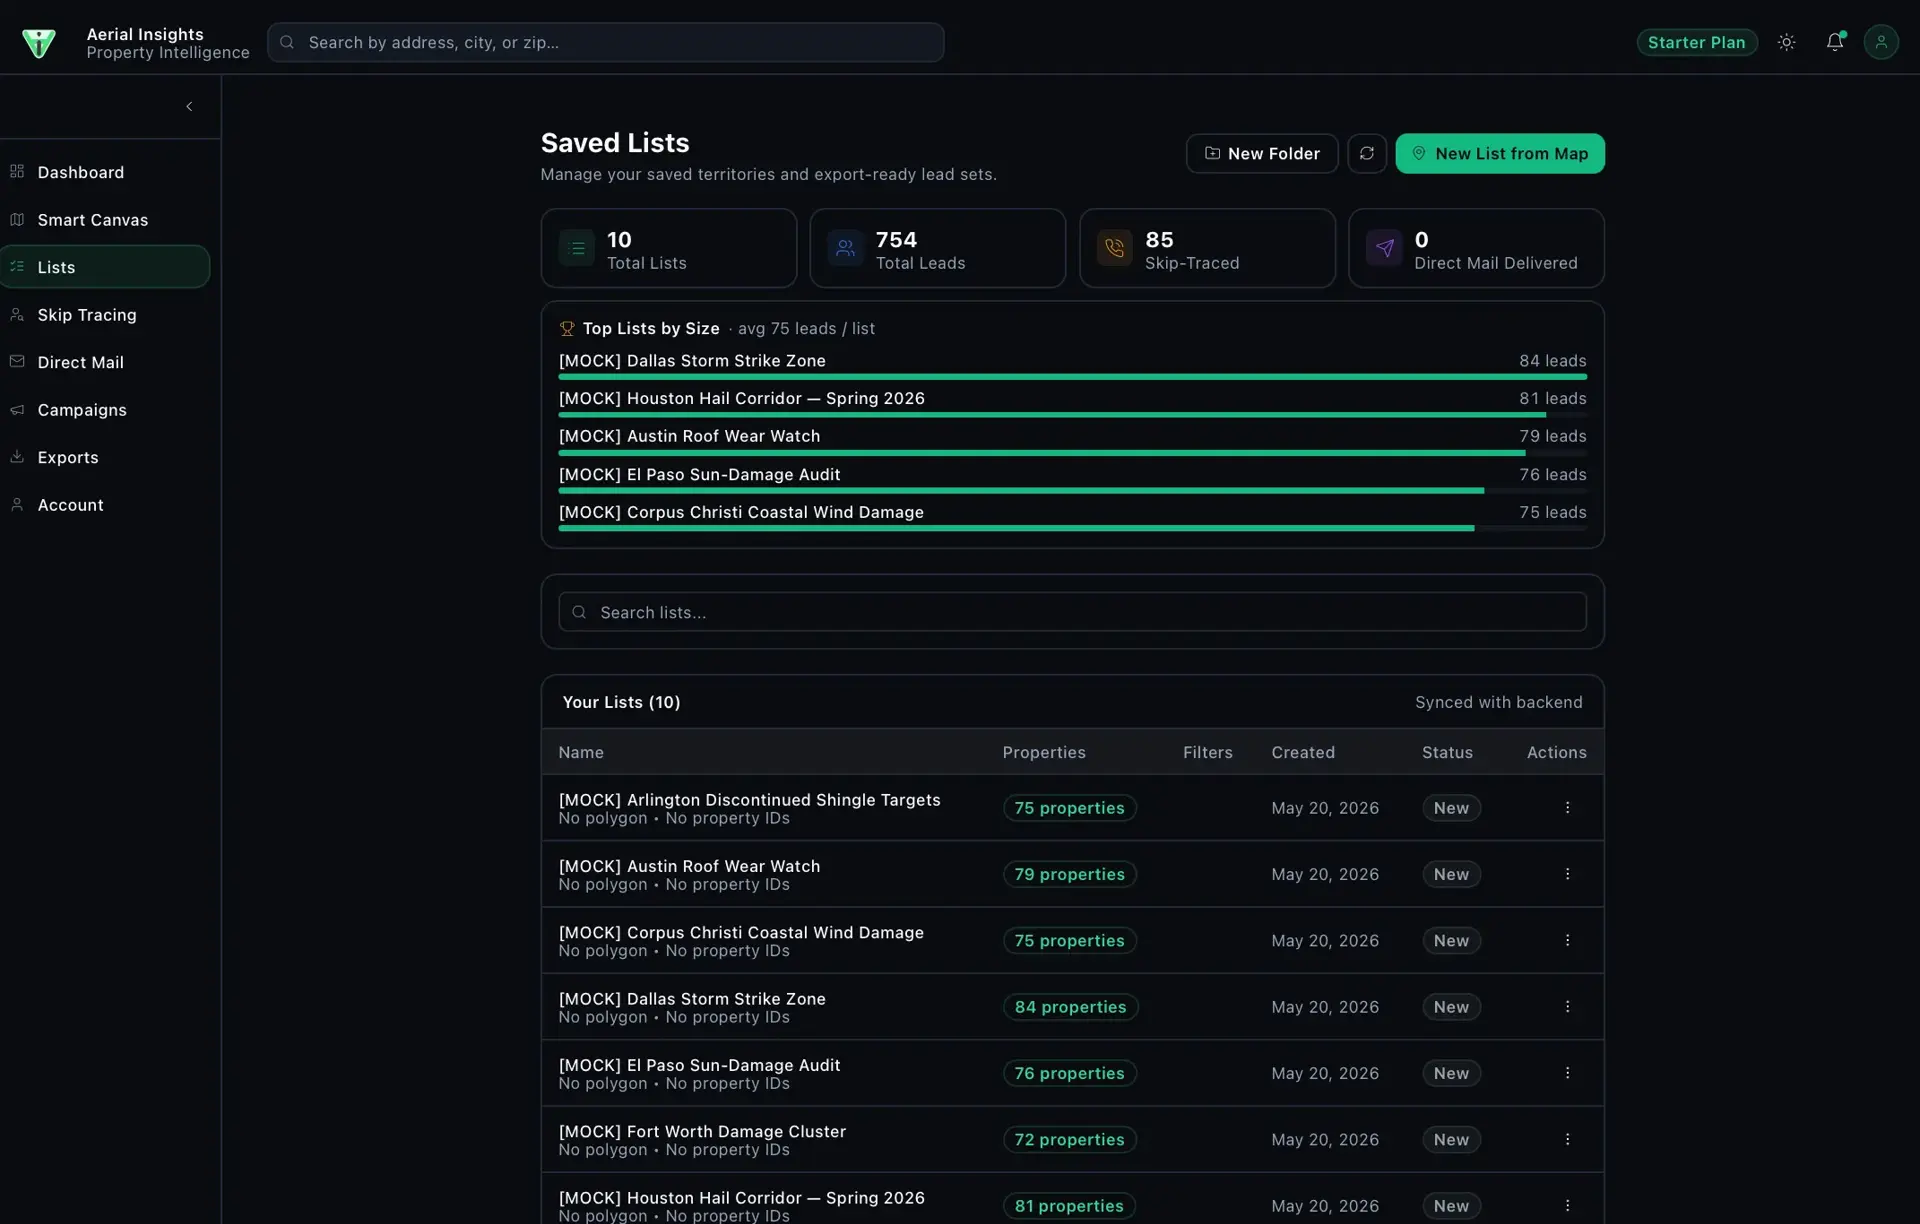
Aerial Insights Saved Lists page: summary tiles (10 lists, 754 leads, 85 skip-traced), a top-lists-by-size bar chart, and a table of 10 mock lead lists with property counts and 'New' status.
Saved Lists overview and table
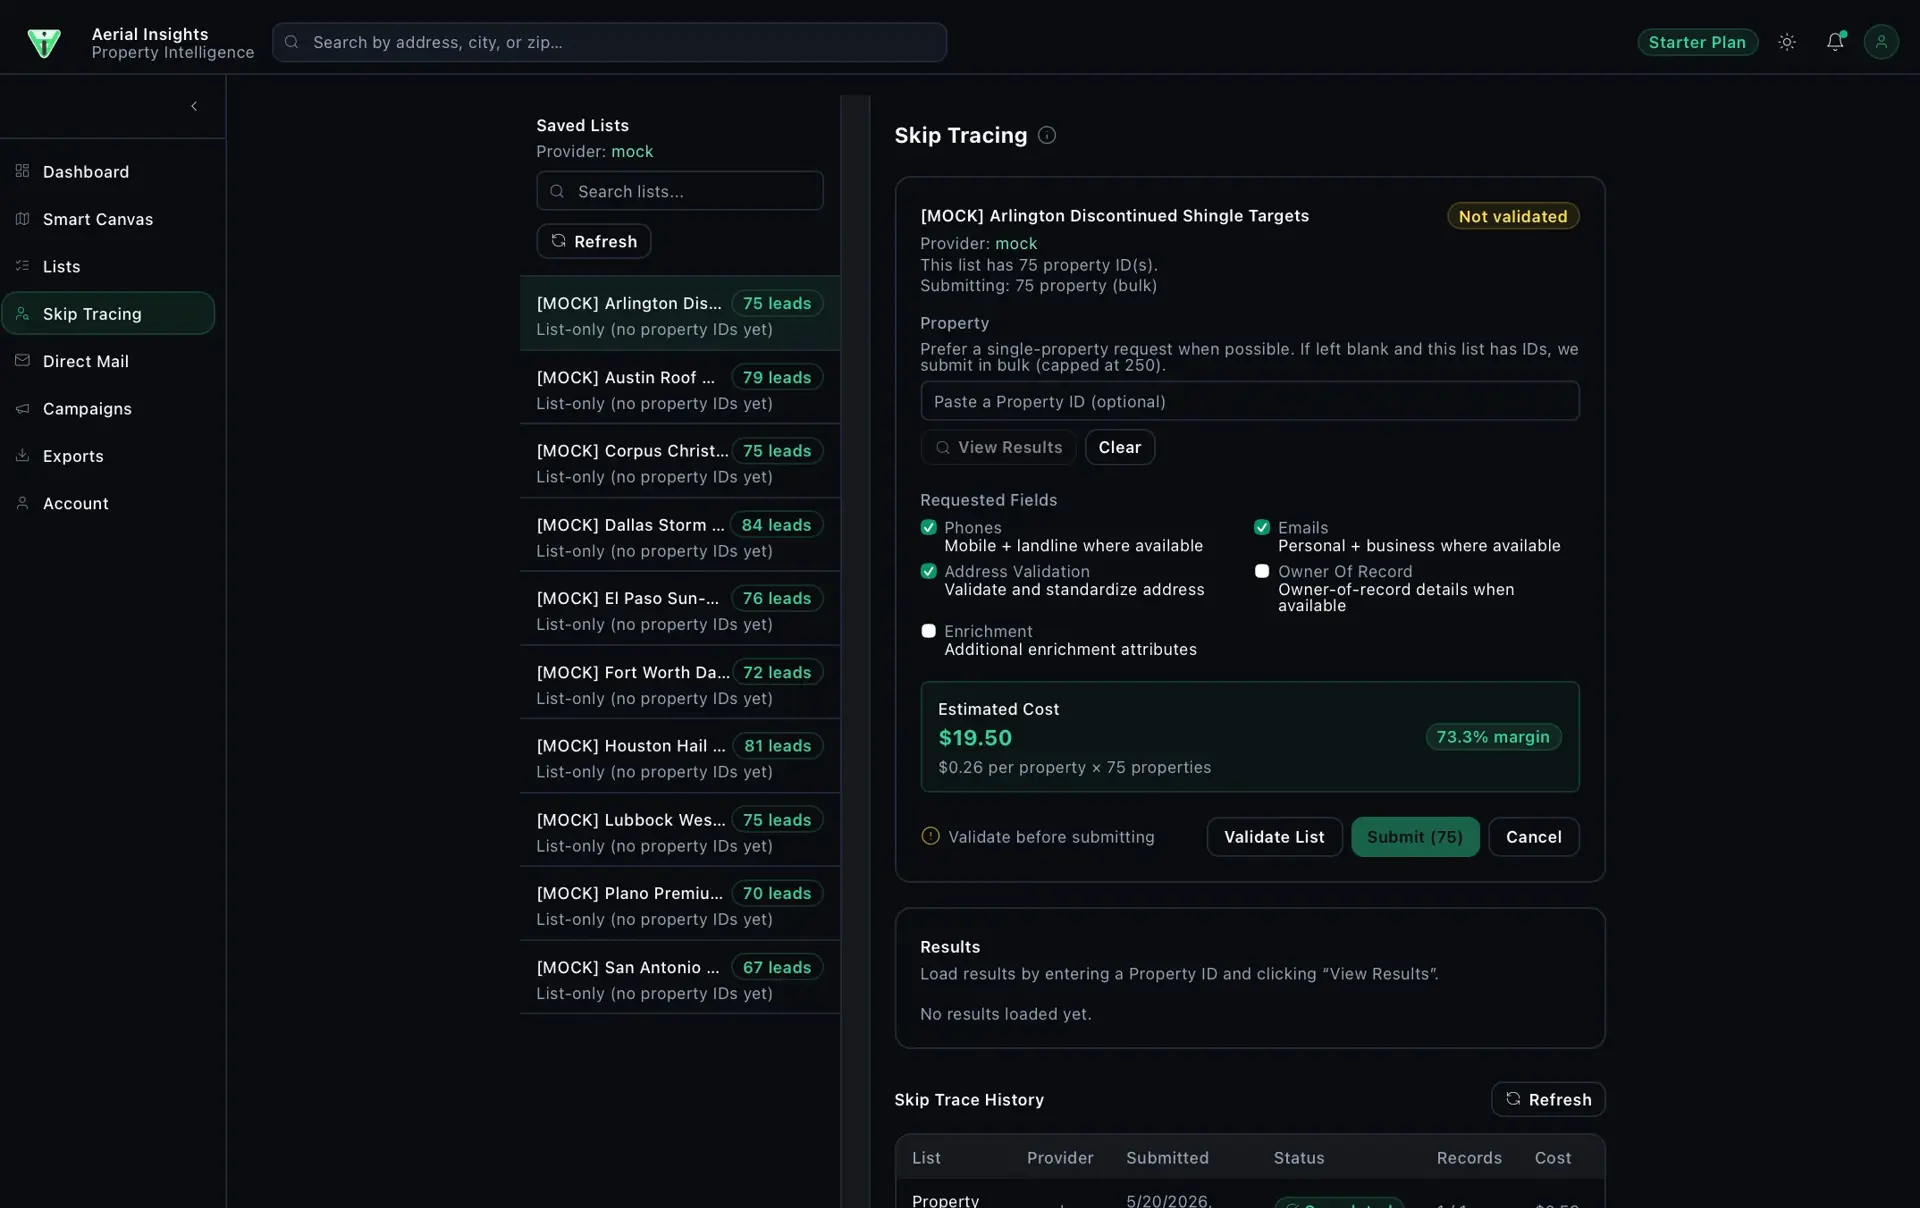
Aerial Insights Skip Tracing page: a saved-lists sidebar and a request form for the Arlington list (75 properties) with requested-field checkboxes and an estimated cost of $19.50.
Skip Tracing request form
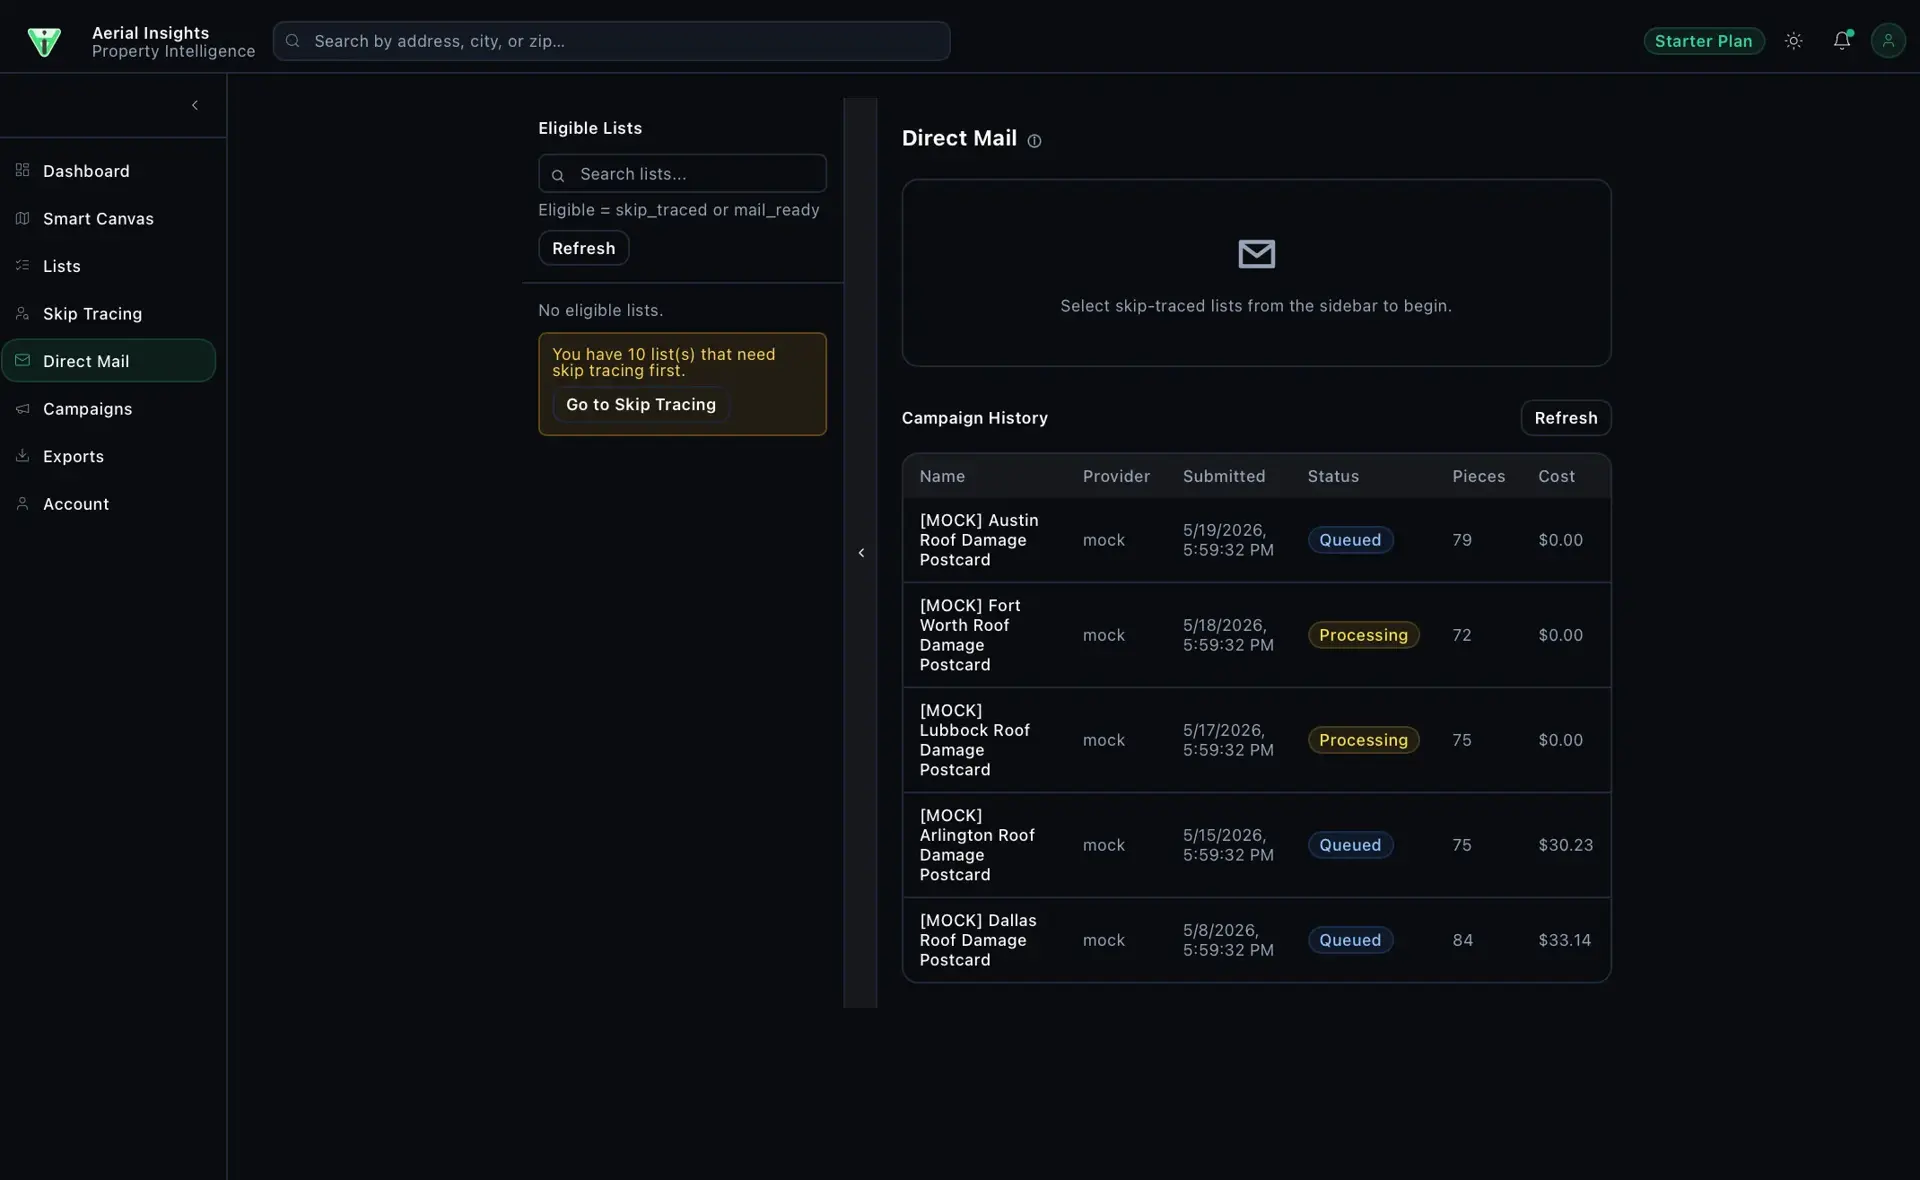
Aerial Insights Direct Mail page showing an empty state ('No eligible lists,' 10 lists need skip tracing first) beside a campaign-history table of queued and processing postcard runs.
Direct Mail — empty state with campaign history
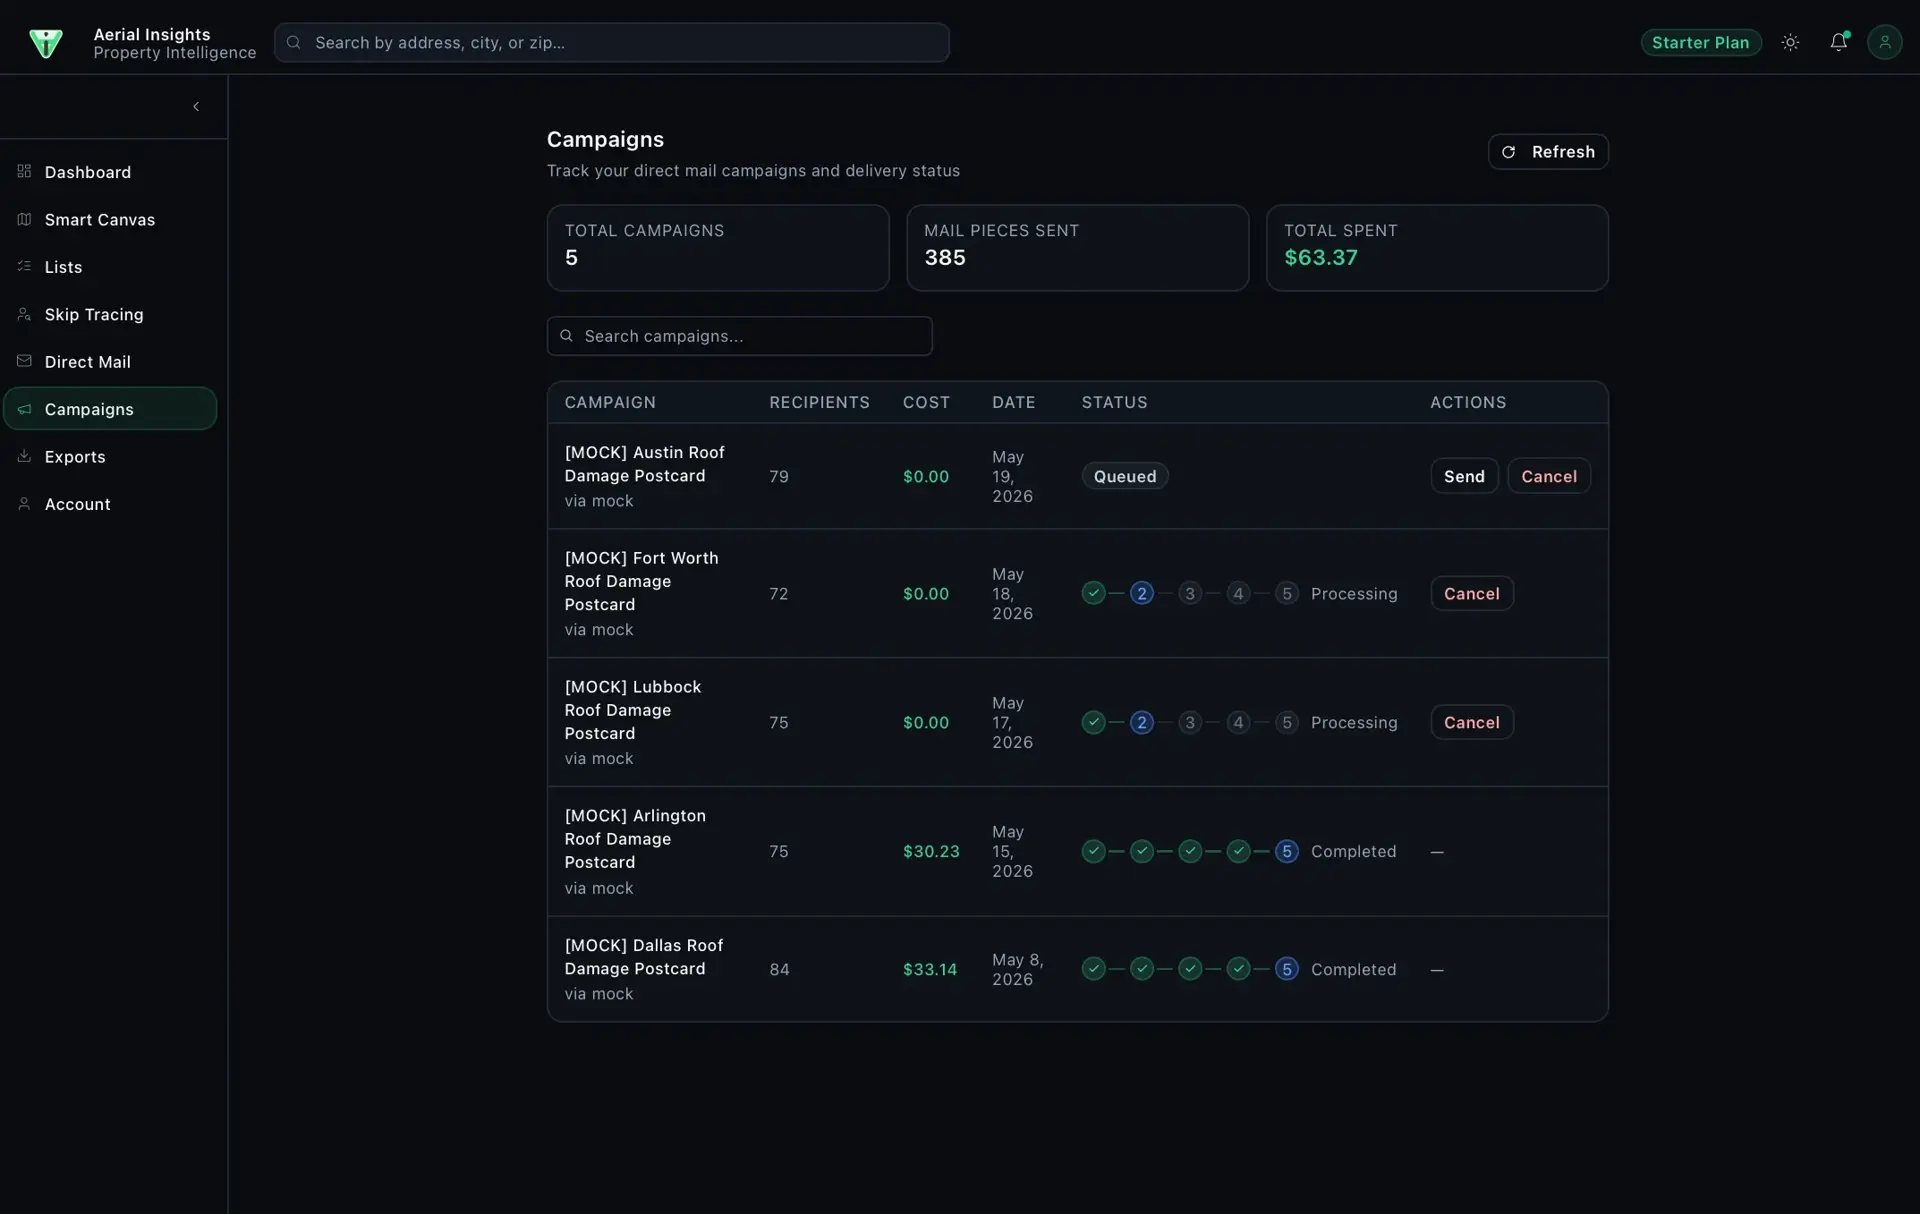
Aerial Insights Campaigns page: summary tiles (5 campaigns, 385 pieces sent, $63.37 spent) and a table of postcard campaigns with recipients, cost, delivery-step progress, and status.
Campaigns — direct mail delivery tracking
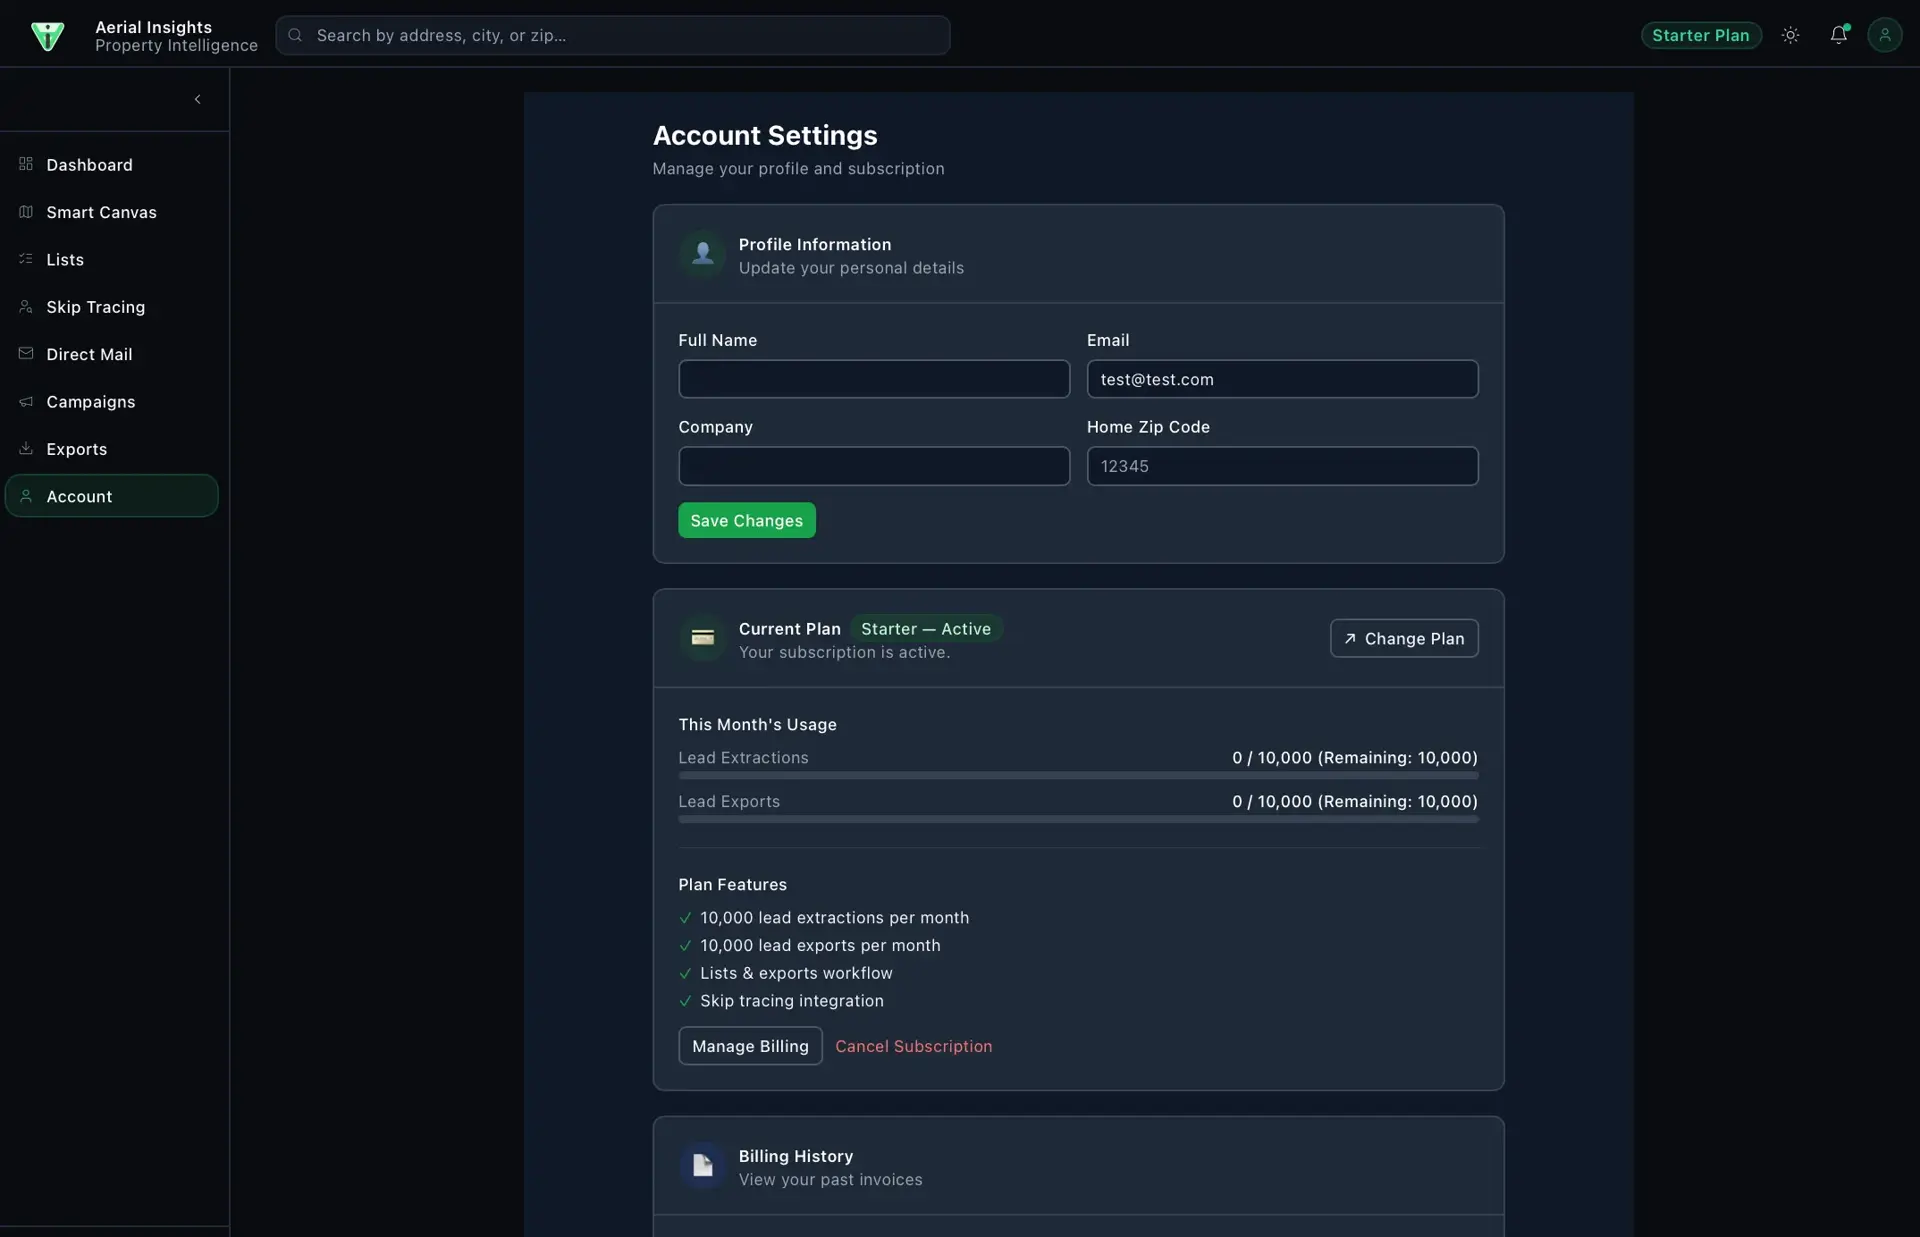
Aerial Insights Account Settings page with a profile-information form, a Starter plan card showing usage meters (0/10,000 extractions and exports) and plan features.
Account settings and plan usage

How it is built

A web application backed by a job queue for image processing. Uploads land in object storage, are processed asynchronously, and results are written back for both the internal dashboard and a client-facing portal.
APIs and services

Roboflow
Hosted inference for roof-damage detection on captured aerial imagery.
YOLOv8
Self-hosted detection weights, selected over the hosted path by a backend switch.
Google Maps
Parcel location and the map surface crews and estimators work on.
Google Street View
Ground-level imagery alongside the aerial capture for context.
NOAA
Storm-event ingestion, backfilled on a schedule, to find recently affected areas.
HailStrike
Hail swath data, narrowing storm areas to properties worth surveying.
Regrid
Parcel boundaries, so a measurement is attached to a legal lot.
ATTOM Data
Property attributes used to enrich a lead before anyone is contacted.
Repliers
Listing data for the real-estate side of the workflow.
IDI Data
Owner contact lookup, priced per lookup and reused within a retention window.
Lob
Printed direct mail to surveyed addresses, triggered from the platform.
Stripe
Subscription billing across four plan tiers.

Classification

Industries
ConstructionReal Estate

Related work

A first-pass AI diligence analyst that builds an acquisition risk profile from public data, APIs, and uploaded documents.

Location intelligence that scores ZIP codes by industry-specific expansion opportunity.

Building something with similar Computer Vision, Geospatial Analysis, Third-Party Data Enrichment functionality?

Start a project and reference this one — the conversation begins with what you have already seen.

Start a project