 Built In Oasis
Freight Fraud Defense Network
Functional DemoFraud defense layer for logistics teams that scores risk before freight moves or money is paid.
Predictive workforce-intelligence SaaS that flags which truck drivers are at risk of quitting, why, and what to do.
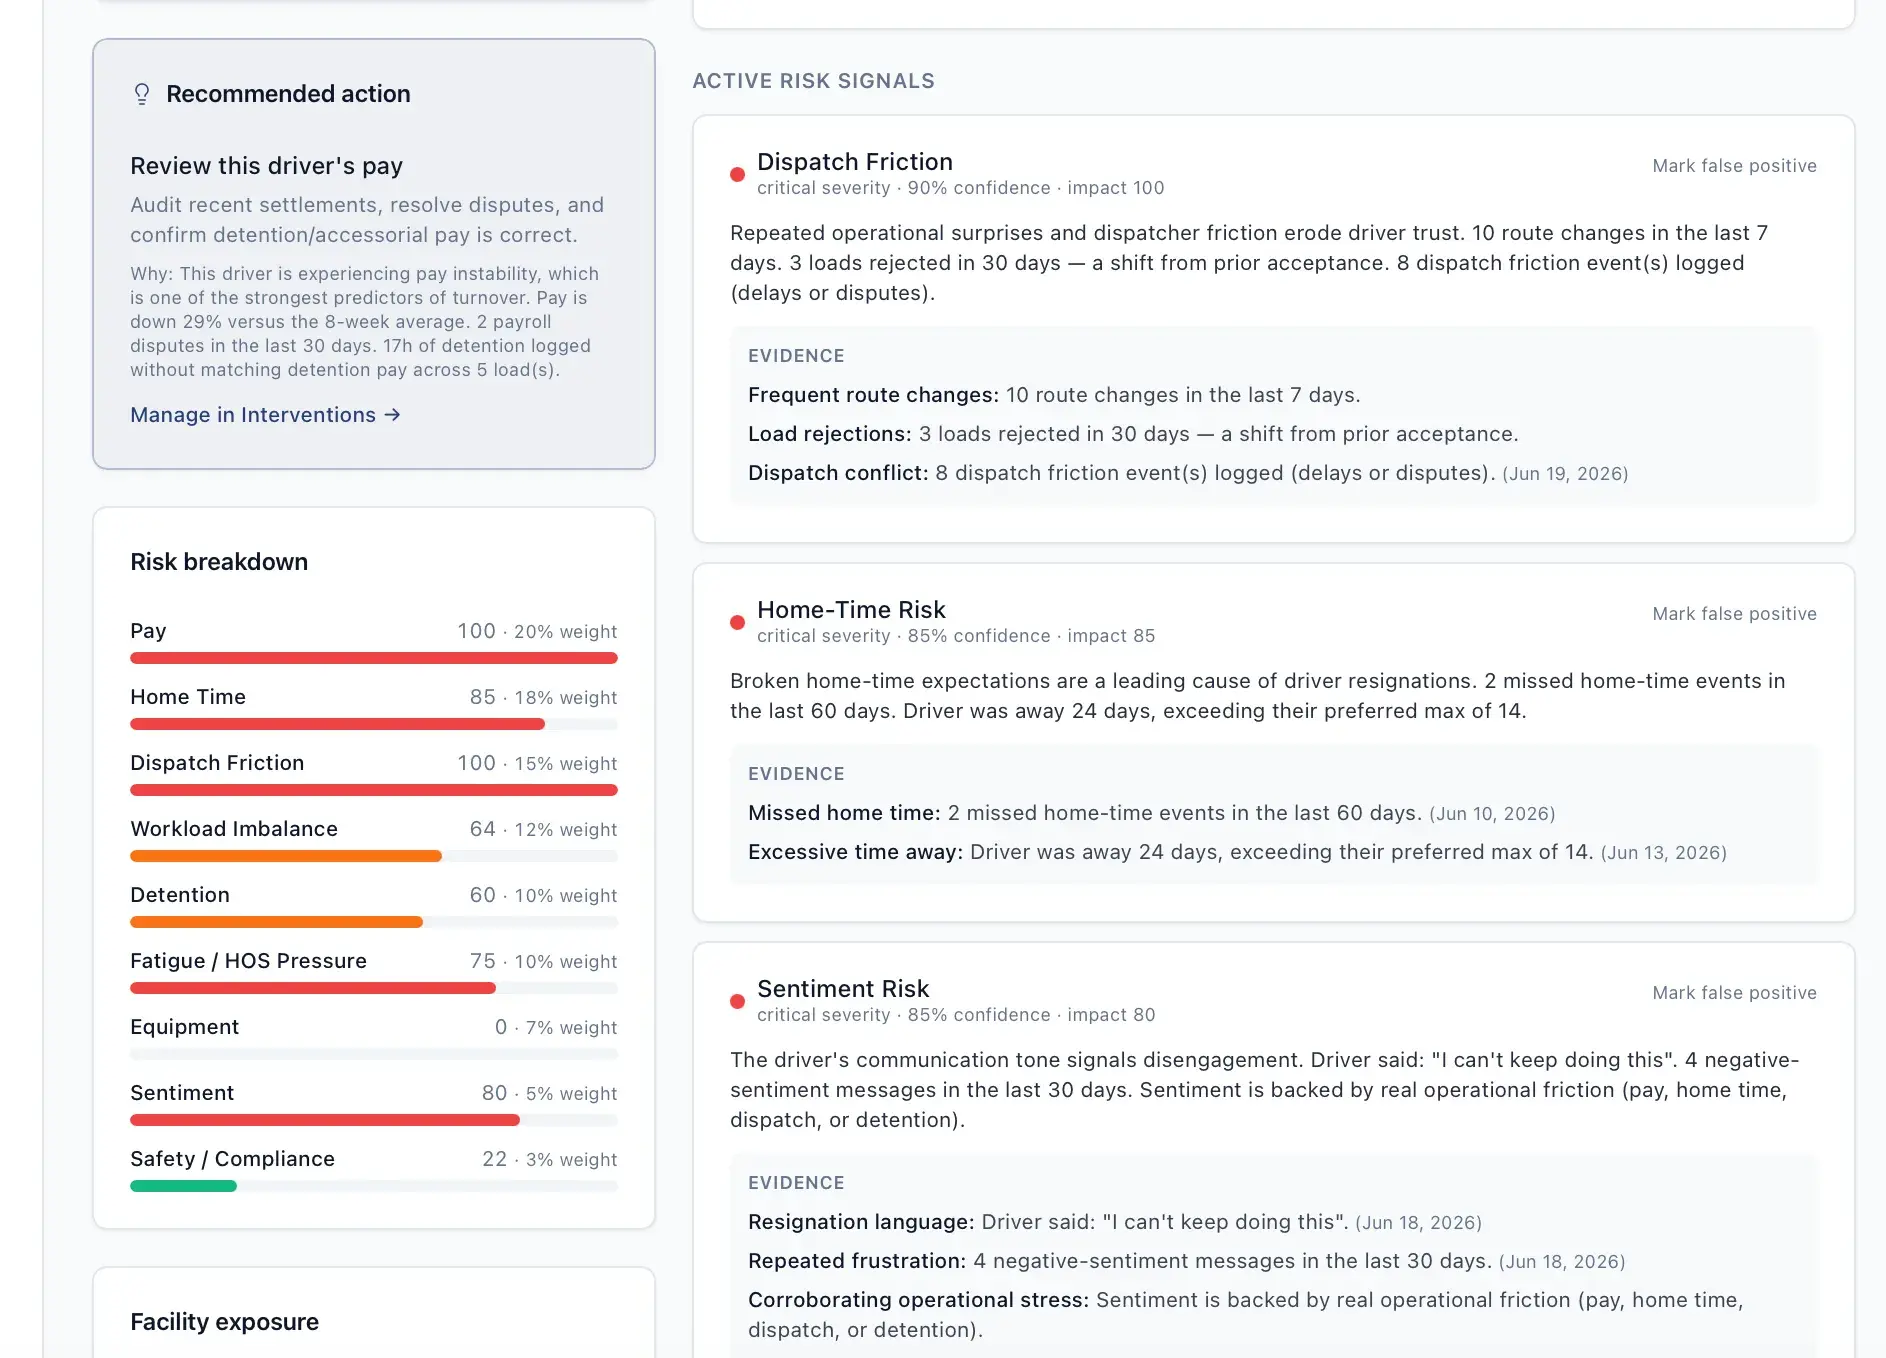
Driver turnover in trucking is expensive, disruptive, and often preventable, but drivers rarely quit over one issue — they leave after repeated friction across pay, home time, dispatch, and workload. Fleets lack an early-warning layer that connects these signals and recommends action before a driver leaves.
Built for Trucking and logistics fleets — fleet owners, operations managers, retention and dispatch managers, HR, and safety/compliance teams.
Driver Retention Risk Engine is an intelligence layer that sits above a fleet's existing TMS, ELD, telematics, payroll, CRM, and HR systems to predict which drivers are at risk of quitting, explain why, and recommend practical retention actions. It scores risk from patterns like inconsistent pay, poor home time, dispatch friction, detention, idle time, and workload. Fleet and HR managers use it to intervene before turnover happens. Nightly jobs recompute risk and surface drivers who need attention.
A Next.js application with role-based access and encrypted integration credentials that computes driver risk scores and explanations over a Prisma/Postgres model. It runs scheduled and queued background work (a worker plus a nightly cron), imports data via CSV, and is covered by unit and Playwright end-to-end tests.
Know which drivers are about to quit, why they are at risk, and exactly what to do before they leave — an intelligence layer that sits above your TMS, ELD, payroll, and HR systems, not a replacement for them.
Integration Layer
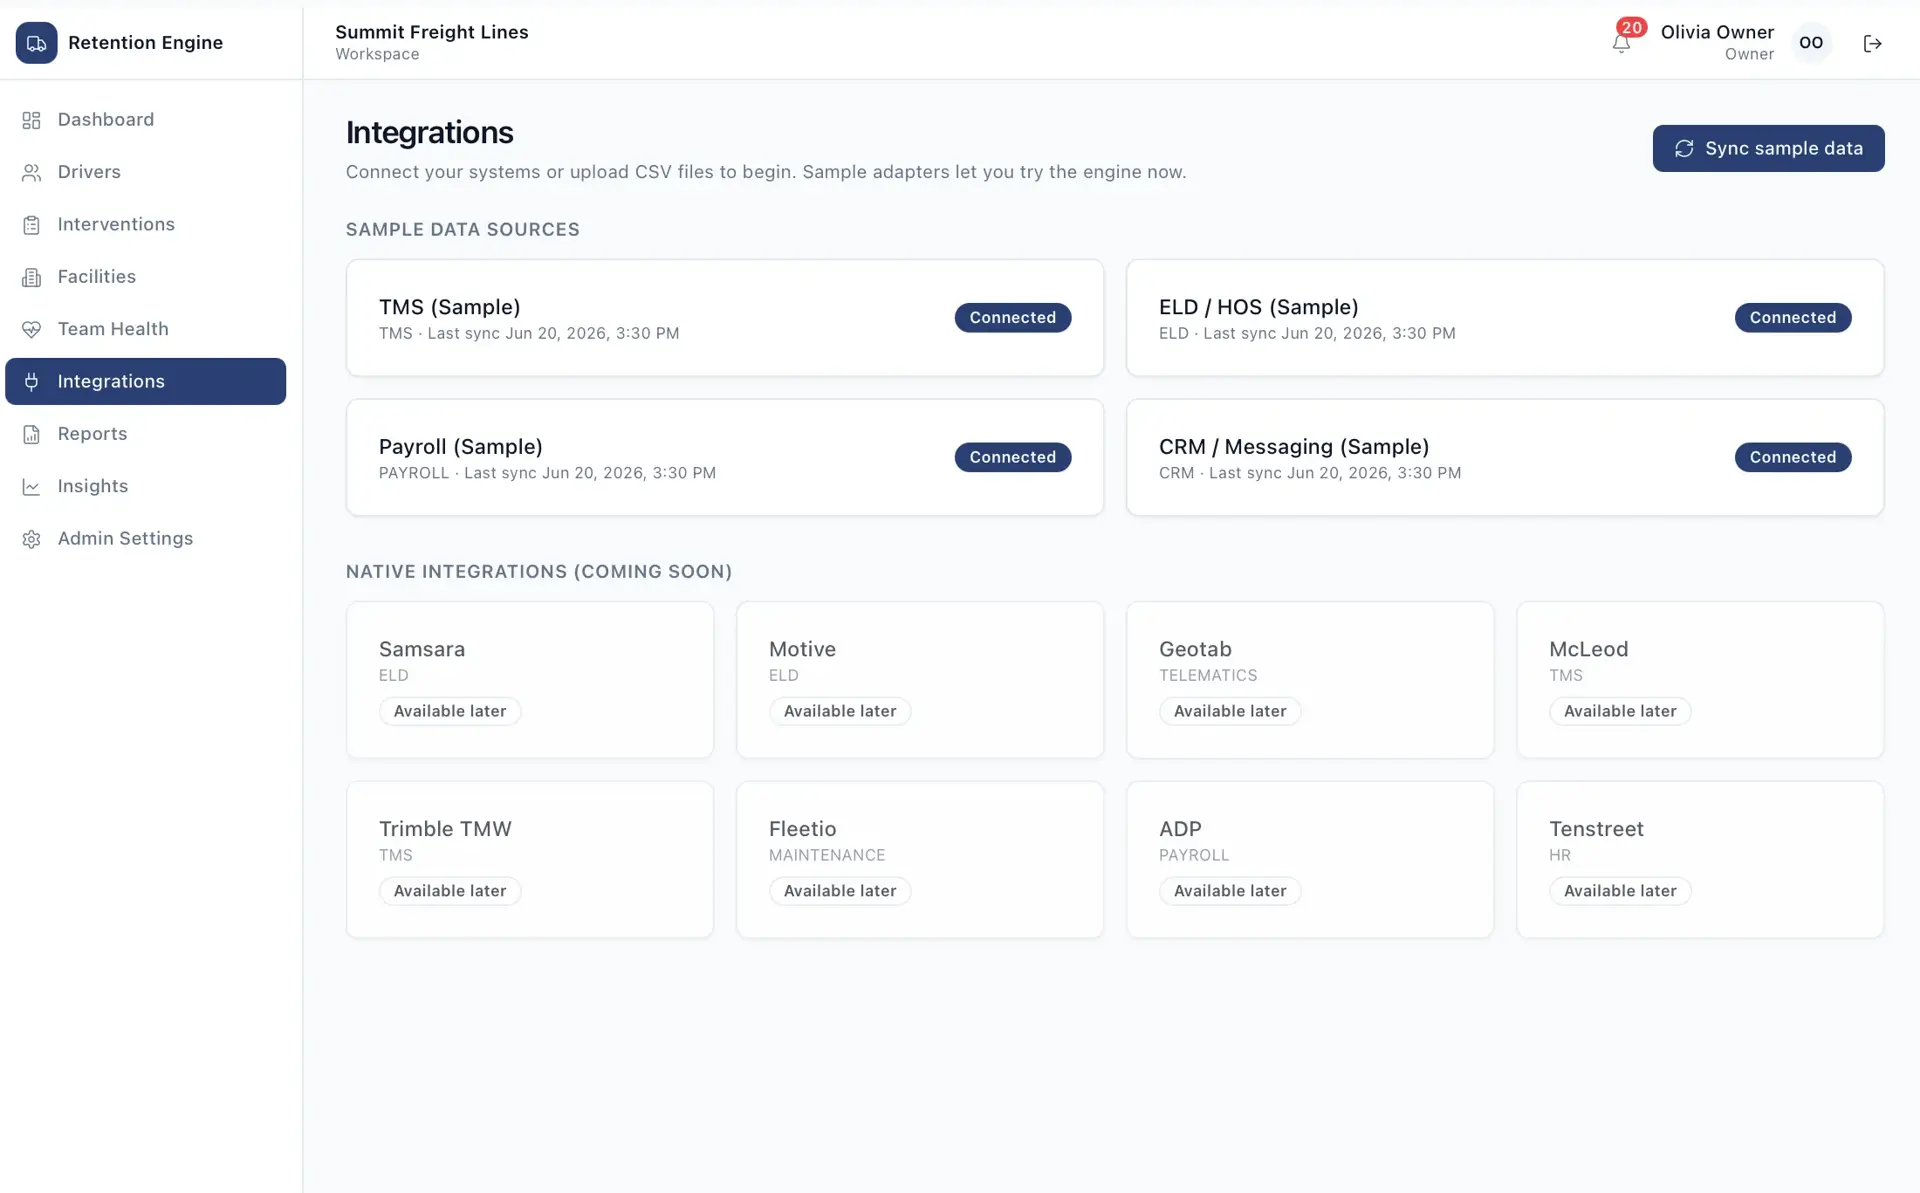
Universal adapter framework for API, CSV, SFTP, webhook, and scheduled syncs across eight system categories.
Data Normalization Layer
Normalizes and deduplicates scattered source data, mapping external IDs across systems.
Unified Driver Timeline
Single timestamped, source-labeled event timeline queryable by driver, date, category, and severity.
Risk Signal Detection
Generates nine signal types with severity, confidence, evidence, and explanation.
Driver Risk Scoring Engine
Weighted, explainable score with category breakdown, trend, and preserved history.
Intervention Recommendation Engine
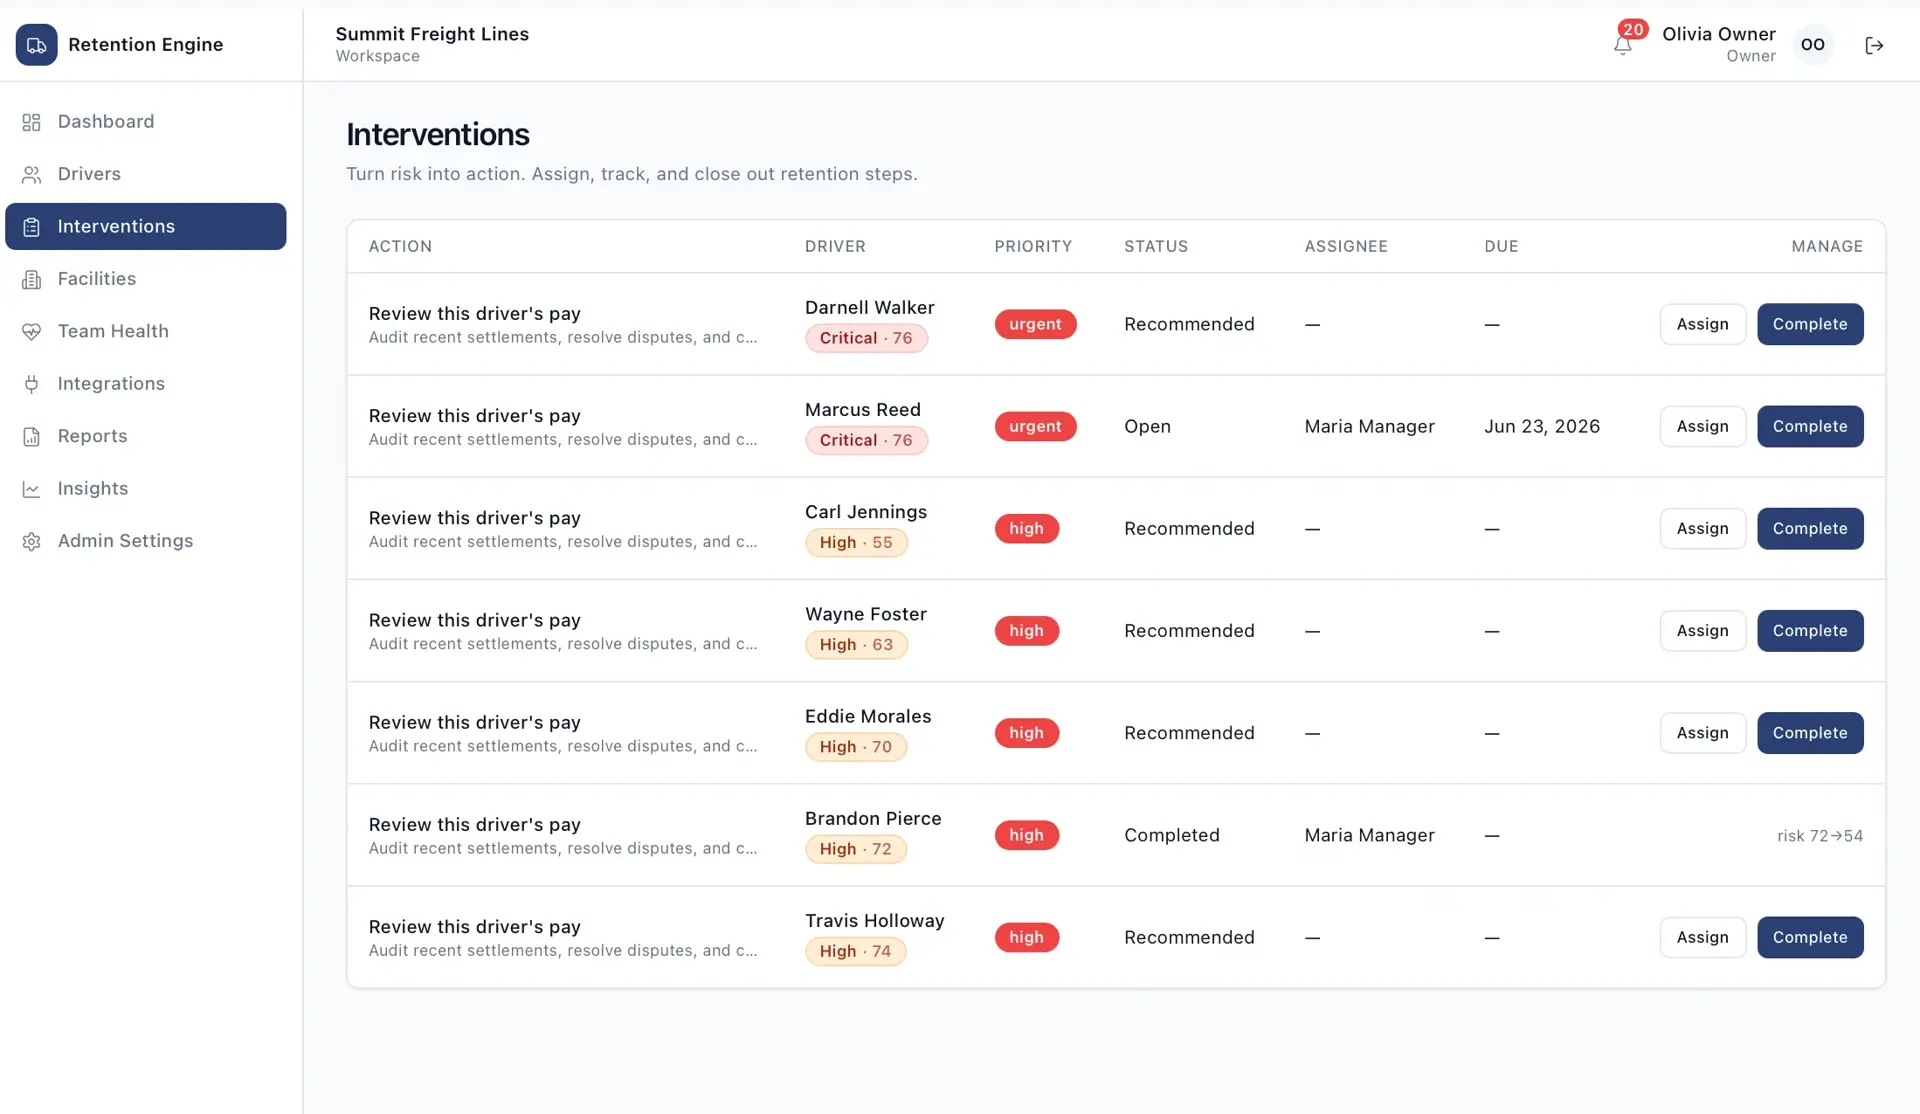
Recommends and tracks retention actions with priority, outcome, and risk before/after.
Facility Friction Intelligence
Groups stops by facility to surface detention, complaints, and churn-correlated locations.
Dispatcher & Manager Health View
Aggregates driver risk by dispatcher and manager, framed as coaching not blame.
Admin Rules & Configuration
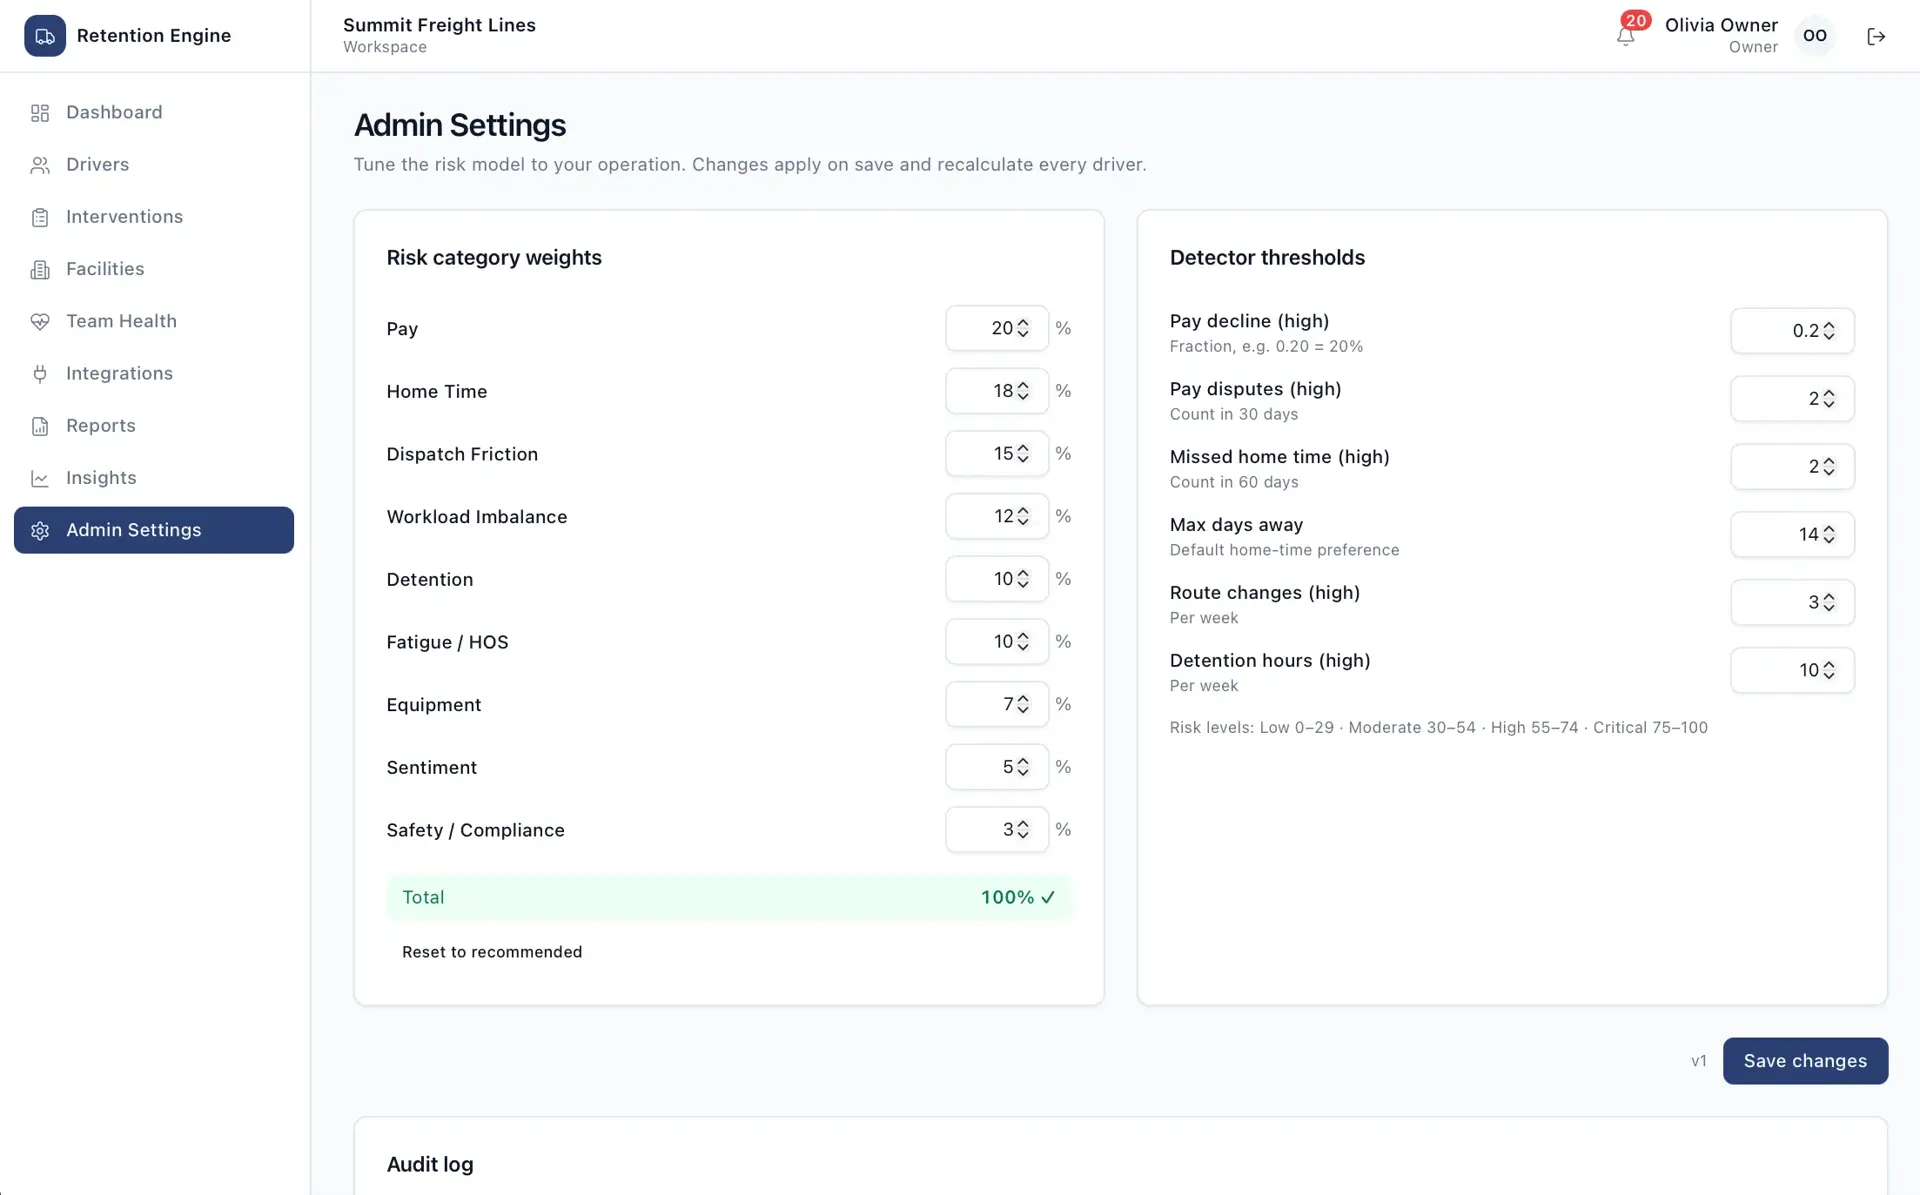
Tunable risk weights and thresholds with versioned, validated changes.
Notifications & Alerts
Deduplicated, prioritized alerts for critical risk, spikes, overdue interventions, and integration failures.
Reports & Executive Insights
Fleet, at-risk-driver, facility, dispatcher, and intervention-performance reports with CSV/PDF export.
Intelligence Improvement Loop
Learns from resignations and intervention outcomes to improve future recommendations.
Driver Risk Score (0–100: Low / Moderate / High / Critical)
Pay decline, variance, unpaid detention, and disputes.
Missed home time and long stretches away.
Route changes, rejections, and dispatcher conflict.
Over/under-utilization and unfair load assignment.
Long shipper/receiver waits and repeat bad facilities.
High drive density, near-violations, and poor rest.
Truck downtime, repeated defects, and unresolved issues.
Frustration, disengagement, and resignation language.
Safety and compliance pressure indicators.
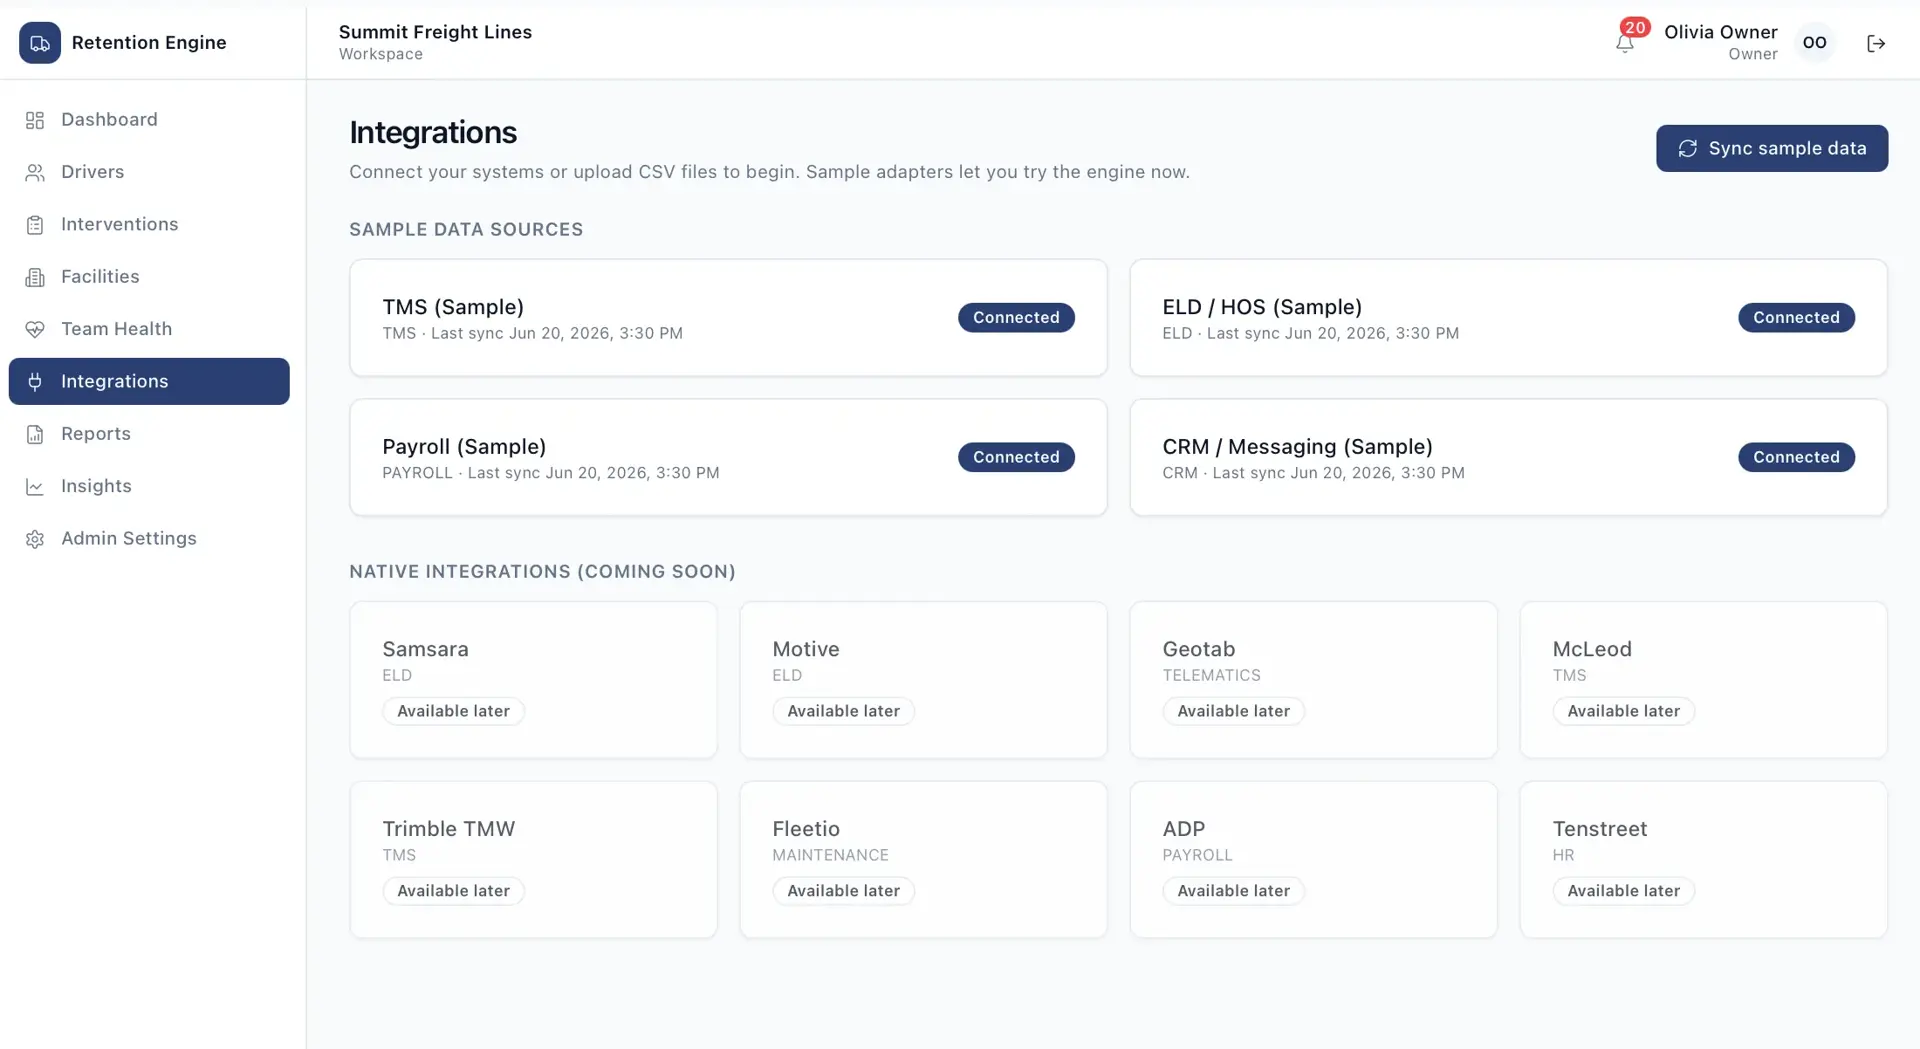
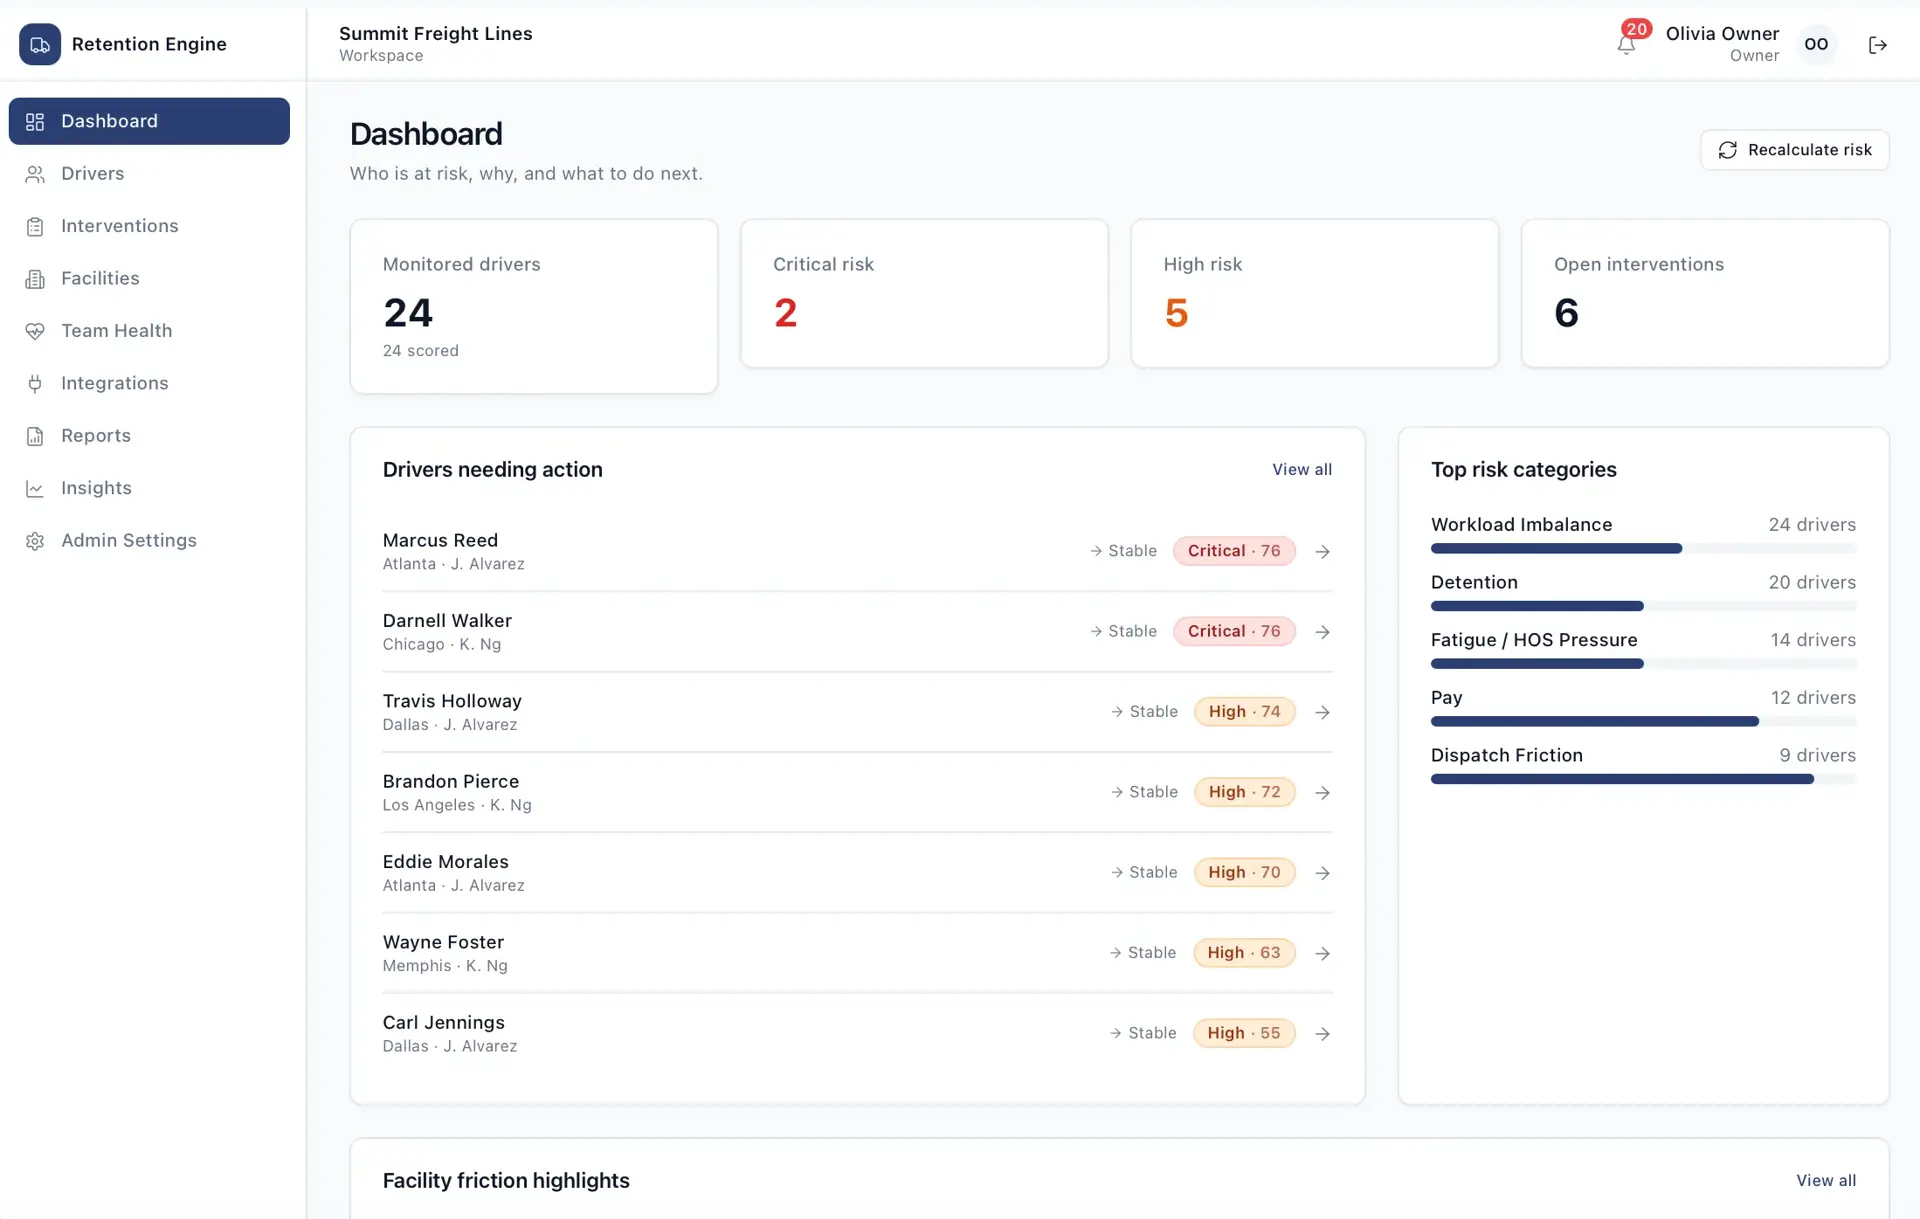
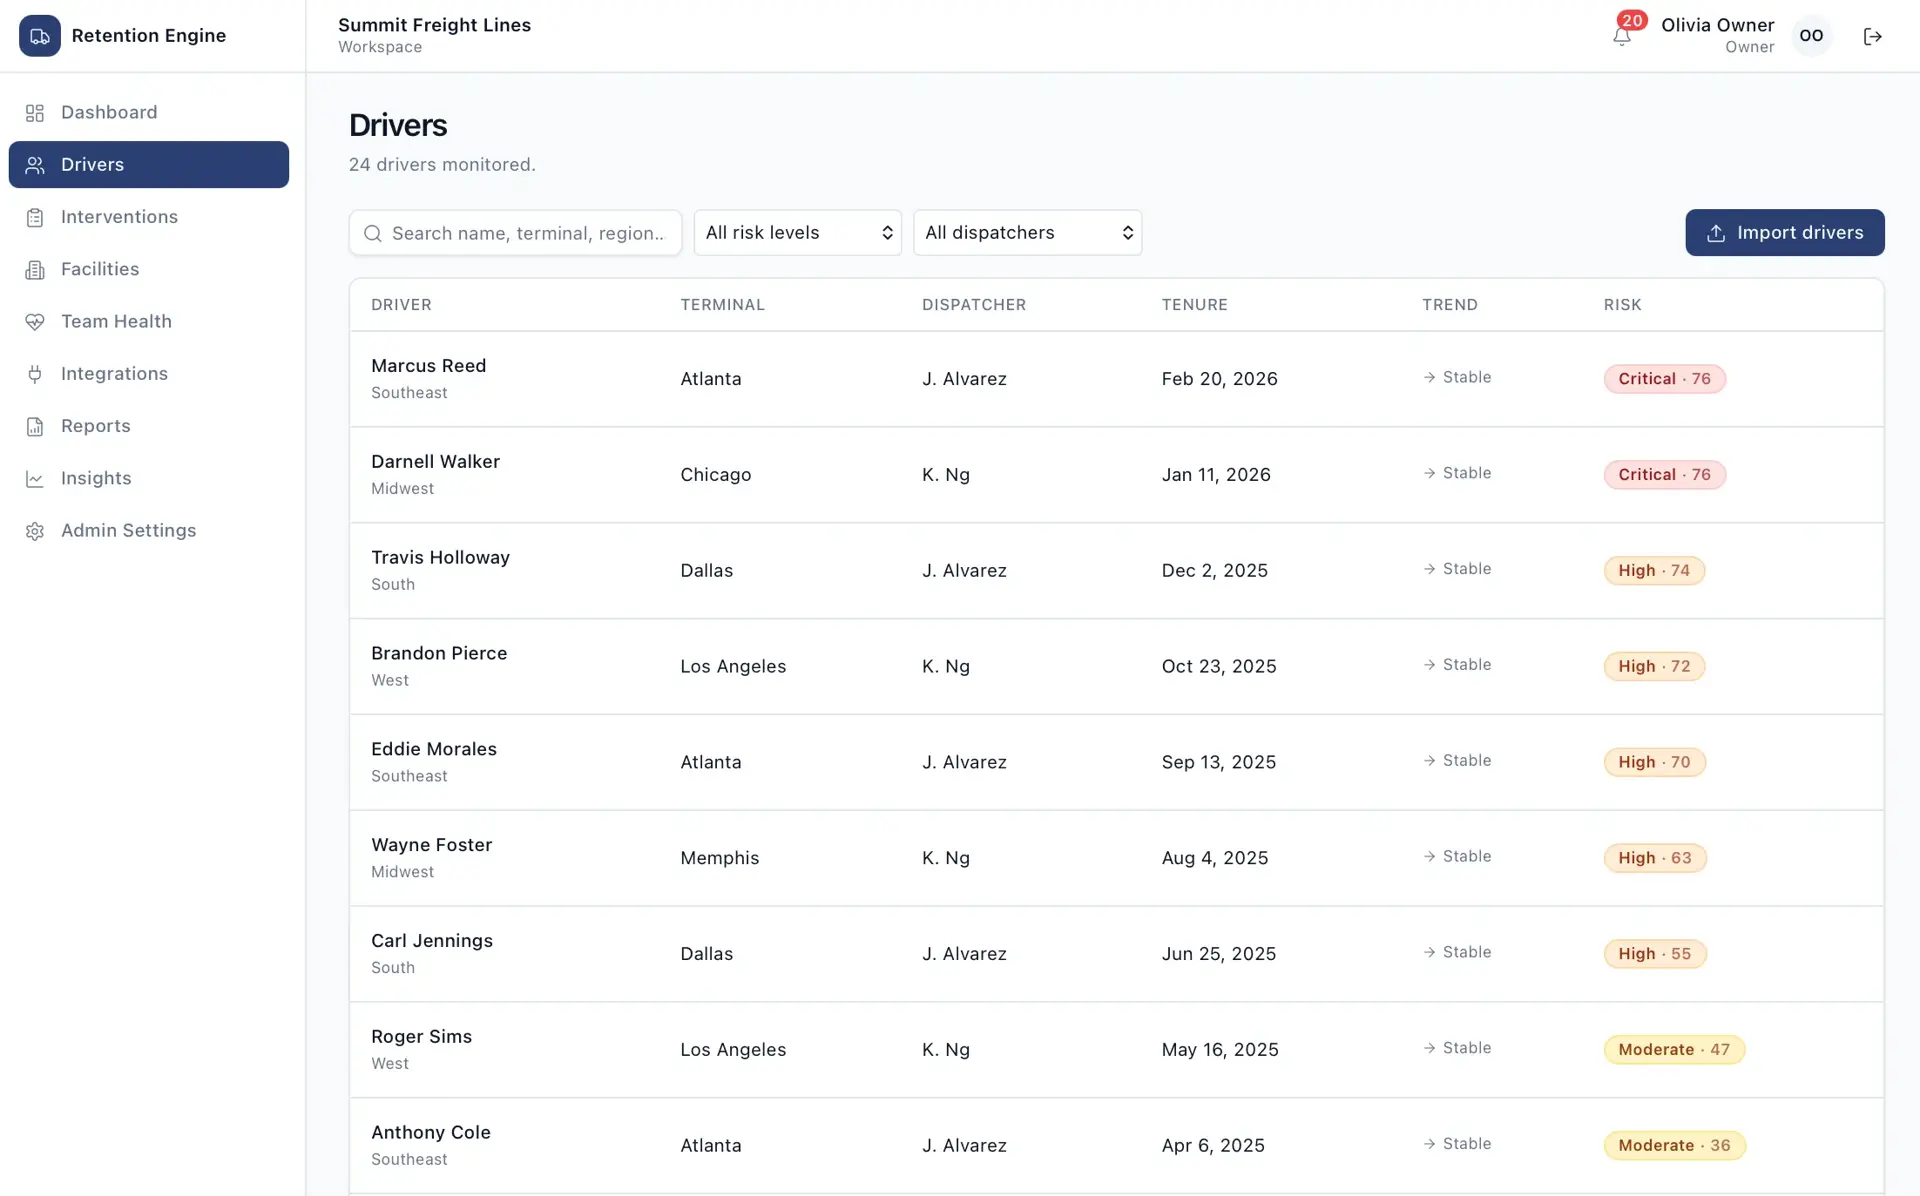
A single Next.js app (App Router) with server-side jobs, Auth.js authentication, and a Prisma + Postgres database via Docker Compose; background processing runs inline in dev and queued in production, optionally Redis-backed.
Fraud defense layer for logistics teams that scores risk before freight moves or money is paid.
Multi-tenant SaaS command center that parallel-dials opted-in leads and routes only answered calls to available agents.
Fuel receipt capture, approval, and reimbursement automation for mobile teams.
Start a project and reference this one — the conversation begins with what you have already seen.
Start a project